HAR (HTTP Archive Viewer) is a JSON file that contains all end-to-end HTTP requests/responses that are sent and received between the client and the server. These files allow developers and testers to learn what actually happens when a transaction is executed and to help find performance bottlenecks and security issues in the original and 3rd party code.
In this example, we have used HAR viewer (http://www.softwareishard.com/har/viewer), a free web-based tool showing a waterfall graph of all calls with the ability to drill down to a specific request.
The following image shows a real-life analysis example of network traffic for a banking wallet app.
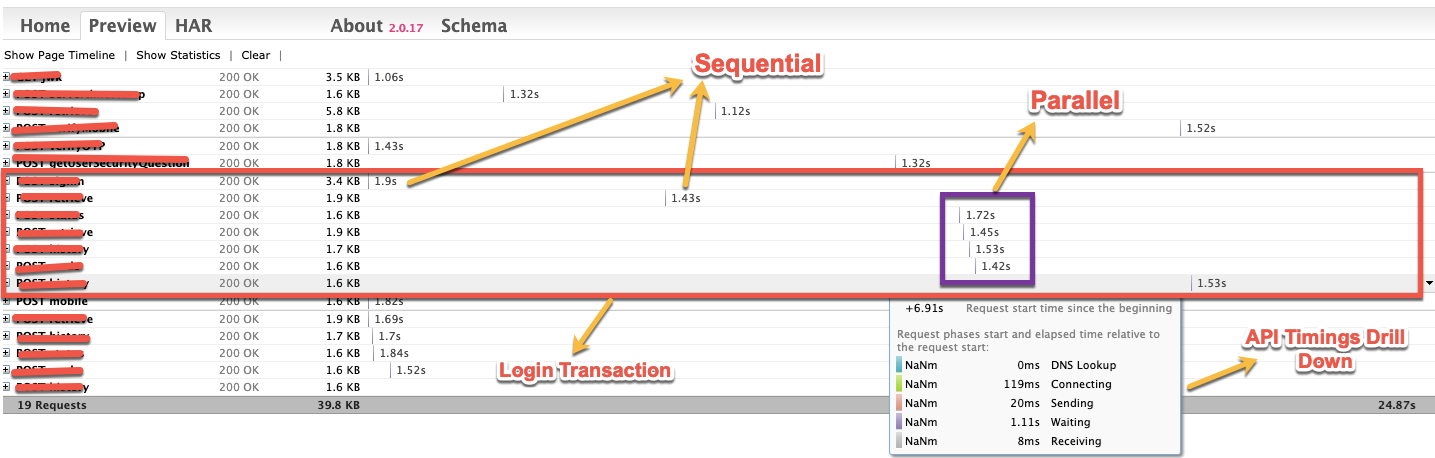
The data was captured as part of SUT performance testing to analyze the following performance metrics for a Login transaction:
- No. of API requests: Track intended/unintended API transactions.
- Identify sequential/parallel requests: For better performance, it is recommended to trigger APIs in parallel rather than sequential, unless APIs are not dependent. More sequential requests result in more page load time.
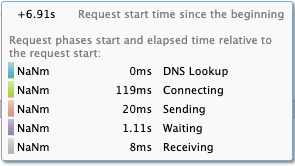
From the above example, in the login transaction, the 1st and 2nd APIs go sequential before a bunch of parallel requests. This means that the system initially took ~3.5 seconds. When we suggested sending those calls asynchronously, the change reduced ~3 seconds of page load time. - API timings: The time taken to process each API call. Each API call involves network time (DNS Lookup, Connecting to Server, Sending Bytes, Receiving Bytes), and server time (time taken by a server to process). This helps in identifying latency involved in client-side or server-side transactions.
A typical developer response, when confronted with the page load time (User Experience Time) of a Perfecto device, is that the reported latency or time is higher because of network hops due to devices being hosted in the data center. For example, test servers are in Dubai, and devices are hosted in the US data center. The HAR file helps isolate the network time of each API call from the actual time taken on the server.
From the above example, one of the calls took 1.53s to finish. Of this time, the network took 0.42s (DNS Lookup, Connecting to Server, Sending Bytes, Receiving Bytes), and the other 1.1s (Waiting Time) is actually spent on the server.
This helped the developer to understand that the reported page load time is associated with the server, not network hops, and requires further tuning. -
Page Load Time – Drill Down: Generally, Server-side tools calculate page load time by summing up the processing time of all APIs on a related transaction, ignoring UX rendering time. Perfecto provides page load time as User Experience Time (UX) with the help of visual functions (OCR and Image analysis).
Page Load Time = UX Rendering time + (API process Time + Network Time)
In this example, the script reported 10.5 secs as the page load time for the Login transaction. Let’s drill down with the help of network traffic. The following table shows login transition API details as extracted from the HAR file.
Req. Start Time from Beginning API Timing Server Time Network Time Parallel Request 0
1.9
1.49
0.41
FALSE
2.5
1.43
1.1
0.33
FALSE
4.97
1.72
1.28
0.44
TRUE
5
1.45
1.03
0.42
TRUE
5.05
1.53
1.1
0.43
TRUE
5.1
1.42
1
0.42
TRUE
6.91
1.53
1.11
0.42
FALSE
The overall process is complicated and manual, but it identifies performance bottlenecks at the user-experience level.
-
Network Time: Total time spent in the network to transfer and receive the packet.
-
Network Time = DNS Lookup + Connecting to Server + Sending Bytes + Receiving Bytes of each API (excluded Parallel Request because it is sent as a bunch)
-
API Process Time: The total time it took to transfer packets and until the last byte reception from the server
API Process Time = (Last API Start Time + Last API Completion Time) – Network Time
API Process Time = (6.91s + 1.53s) – 1.6s = 6.84s
Thus, the login transaction APIs took 8.44s to process, spending 1.6s in the network to transfer and receive the packet.
-
UX Rendering Time: The total time it took to render in the UI.
UX Rendering Time = Perfecto Page Load Time – (API Process Time + Network Time)
UX Rending Time = 10.5 – (6.84s + 1.6s) = 2.1s
The final breakdown of the reported login Page Load Time of 10.5s will be:
Page Load Time = UX Rendering time + (API process Time + Network Time)
10.5s = 2.1s + (6.84s + 1.6s)
-