In the Perfecto desktop app, the Automation tab looks as shown in the following image.
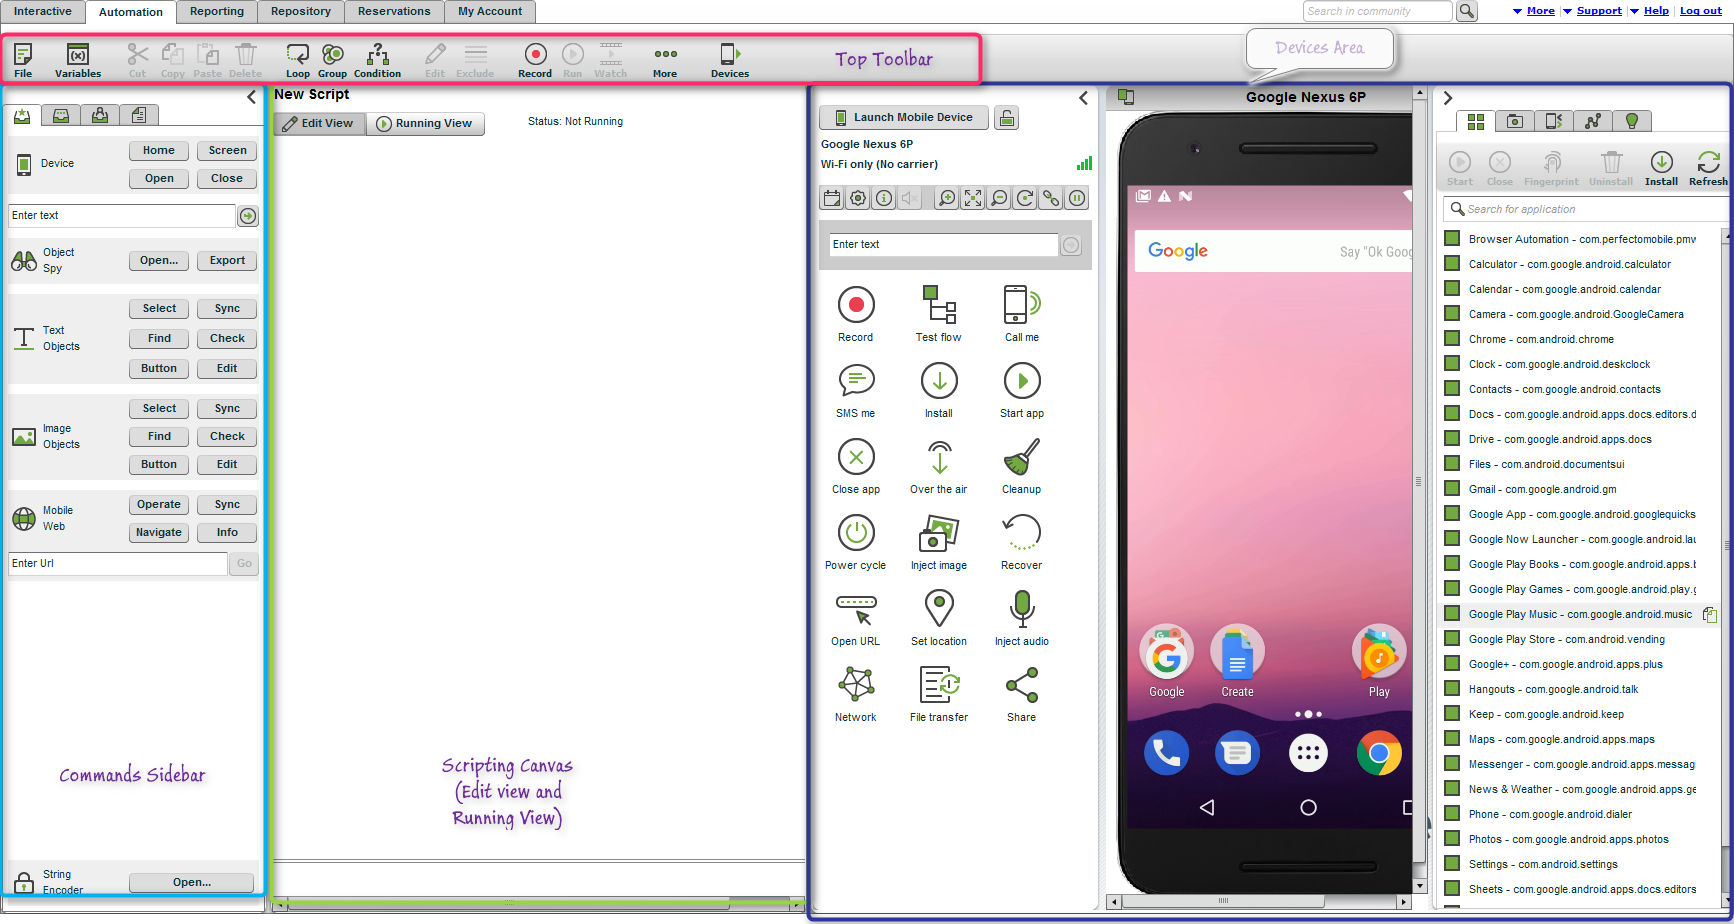
The interface includes four main areas:
- Top toolbar: Includes icons for control of the script and its commands
- Commands pane (left): Presents four tabbed areas that provide selections of commands to include in the script
- Scripting canvas: The area where the script is built (in Edit view) or Run (in Running view)
- Devices area: Displayed by clicking the Devices icon in the top toolbar
Top toolbar

The toolbar includes the following tools:
| Icon | Description |
|---|---|
| File | Create new, open existing, save current,and print scripts |
| Variables | Create script variables and modify existing variables |
| Editing tools | Cut, Copy, Paste, and Delete icons to edit the script commands |
| Control elements | Loop, Group, and Condition icons to add control commands to the script |
| Edit | Edit the parameters of the selected command |
| Exclude | Comment out the selected commands |
| Record | Begin recording the interactive actions on device as script commands |
| Run | Run the script |
| Watch | Presents a video presentation of the last script, as it appears on the device declared to be device under test (DUT). |
| More | Opens a menu that allows you to edit the script properties, export the XML, access the log file, or execution report |
| Devices | Opens the devices area - important for device selection (see below) |
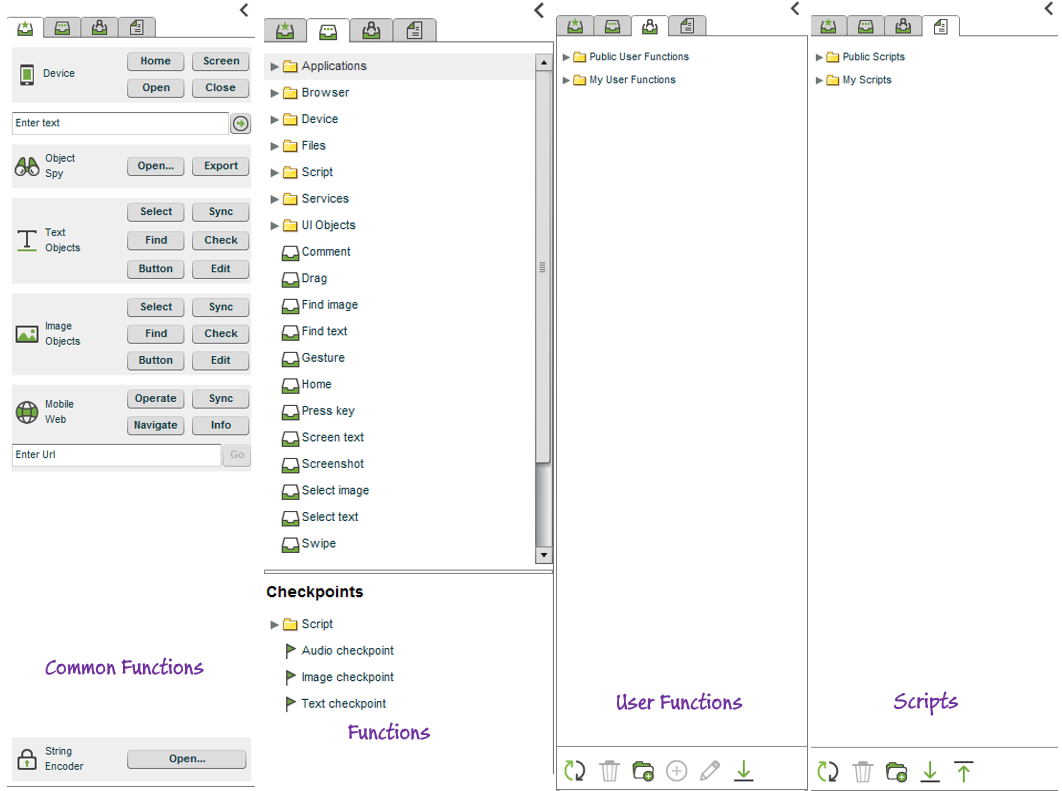
Commands pane
The commands pane appears on the left side of the UI and presents tools used to add commands to the automation script. The commands are organized into four tabs:
|
Tab |
Description |
|---|---|
|
Common Functions |
Provides easy access to add commands that are most common - for example, Home, Select object, Navigate to URL. |
|
Functions |
Provides a list of all Perfecto-defined commands. For more information on these commands, see the REST API documentation. |
|
User Functions |
Provides access to all user-defined commands stored in the Perfecto Lab Repository. |
|
Scripts |
Provides access to scripts stored in the Perfecto Lab Repository. |
Scripting canvas
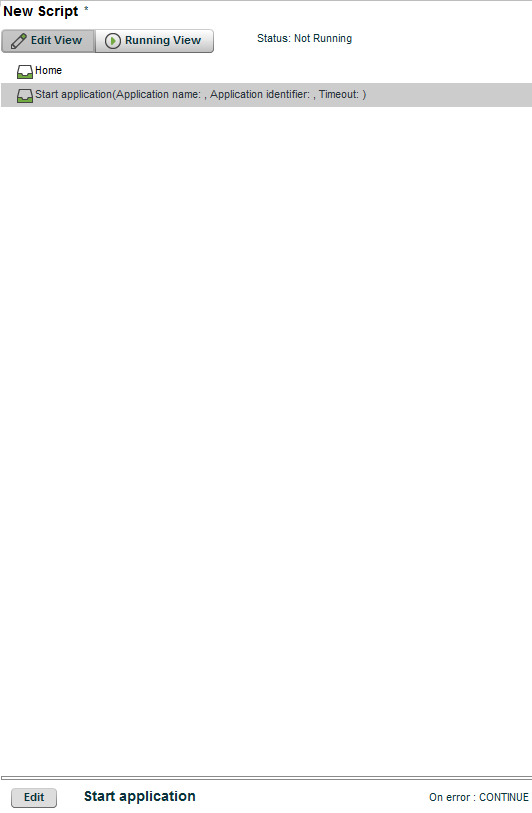
The scripting canvas is where the script commands are listed. The canvas supports two views of the script - controlled by the two selector buttons at the top:
- Edit View - lists the commands, and allows you to edit the command parameters (either by selecting the command and clicking the Edit button, or double-clicking the command line).
- Running View - Displayed when the script is executing. Displays which command is currently executing, elapsed time for the command execution, and status of the execution (success or failed).
Devices area
Displayed by clicking on the Devices icon in the toolbar. Supports selecting a device from the lab, and displays it in the window.
This area displays a full Interactive UI. In most cases (and by default) the right and left panels of the UI are hidden.