The Device Dashboard allows designated users to view multiple open dedicated devices, within their organization, in one window. This is a view only mode, device manipulations cannot be made. Rather, the purpose of this feature is to allow users to view devices currently being tested. This includes monitoring devices in both automation and interactive sessions.
This tool allows users to view exactly what is actually running on their devices, without the need to open the IDE or the execution center. In the "full auto pilot" mode, the displayed videos are dynamically replaced based on actual activities.
This feature is only available for dedicated devices.
To open the Device Dashboard:
From the More menu, select Device Dashboard.
To open devices:
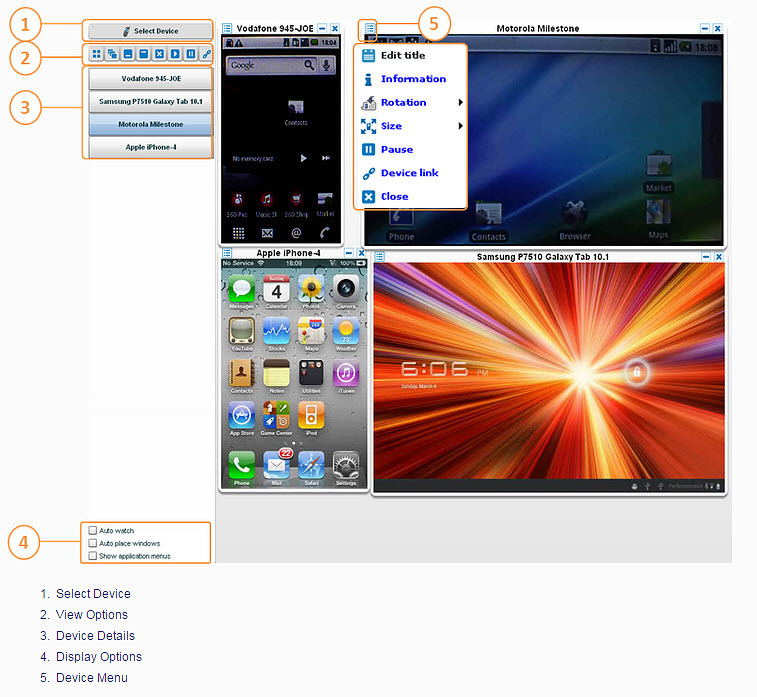
- Click Select Device.
- Select multiple devices with CTRL and SHIFT.
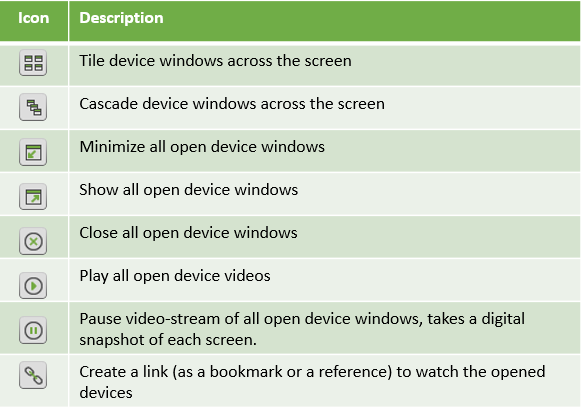
Device Dashboard icons
Display options
Auto watch - automatically opens up to 10 random dedicated device screens. When more than 10 devices exist, they will continuously be auto switched.
Auto place windows - automatically places open device windows across the screen. This may be useful when choosing the Auto watch option.
Show application menus - displays the application menu located at the top right side of the screen. Included are the Settings, Help, and Log out options.
Device menu
It is possible to rotate, change the size, pause, get information, get the device link, and close each device on the device dashboard.
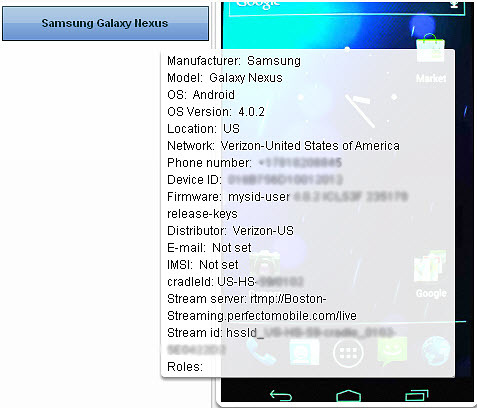
Device details
Device details can be viewed by placing the mouse over the desired device name in view options.