The Heatmap presents an overview of the test results. The results appear as color-coded cross-sections (see the Color code key) of tests. Each block in the display represents a group of tests.

The tests are grouped by a primary grouping and, if possible, split into a secondary grouping. You can select the primary and secondary grouping properties in the Filter/Group pane on the right. The selected group properties are displayed at the top of the dashboard. The size of each group area in the main display area is displayed relative to the number of tests represented.
You can use the following factors to group tests:
- Browser
- Device ID
- Device model
- Operating System
- Resolution
- Form factor
- Job
- Project name
- Project version
- Tags
- Test
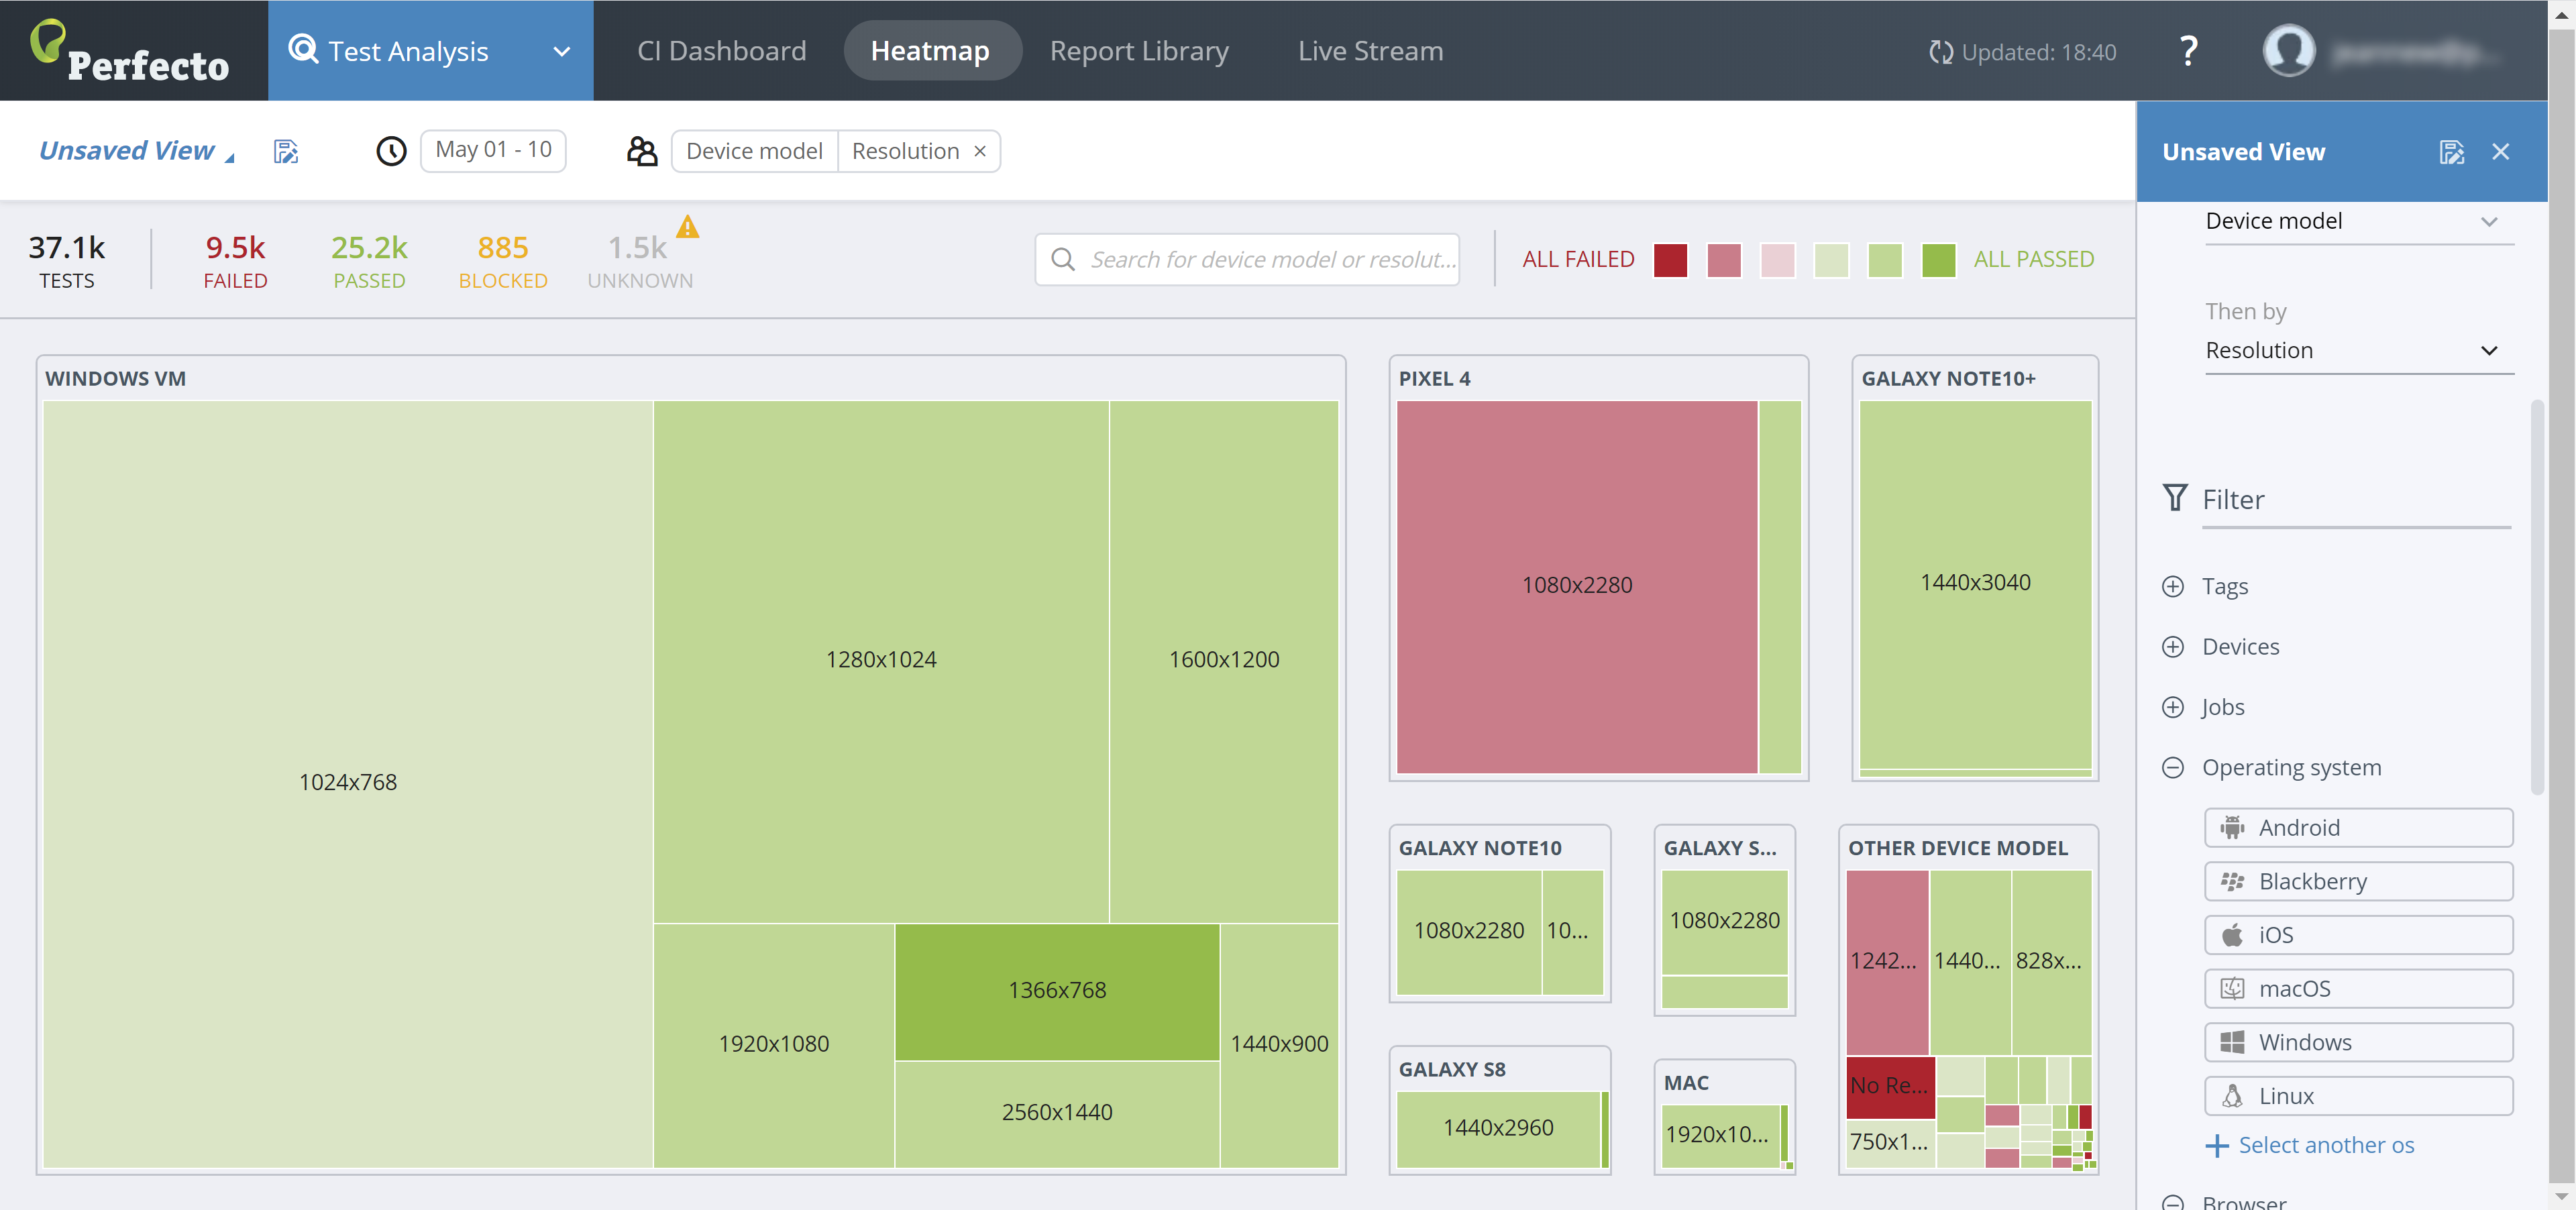
The following figure shows the same dashboard, with the cross-section redefined to be Device model (primary) and Resolution (secondary).
Narrow the number of test results included in the display by filtering the results by any of the following (via the Filter section in the right pane):
- Browser
- Devices
- Device Type
- Operating System
- Tags
- Results
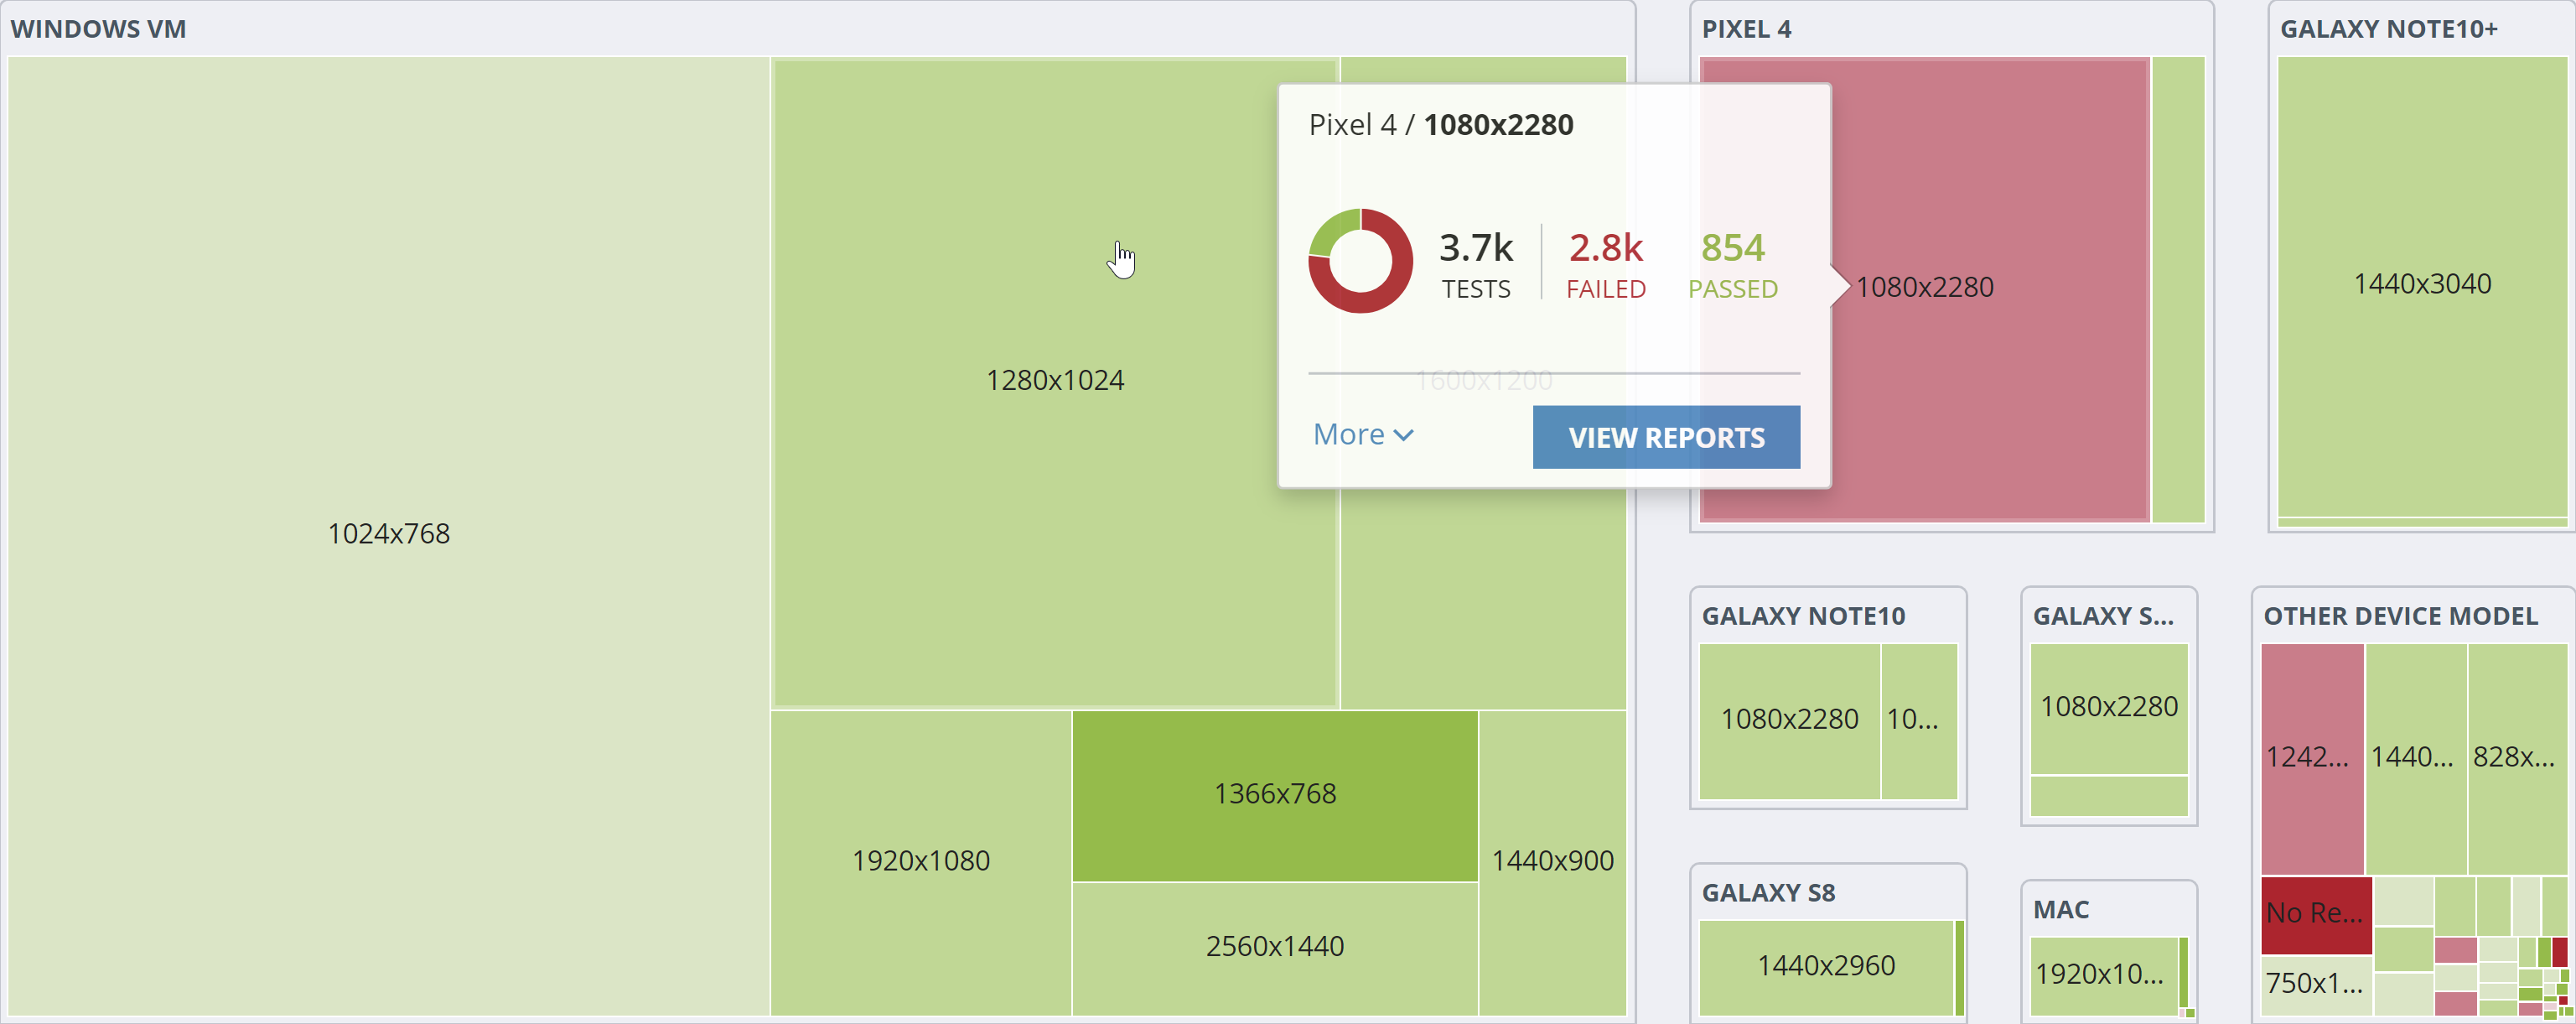
When moving the pointer over any of the groups, the system presents the statistical summary of the tests in that group. From here, you can also access the reports.