The Smart Reporting feature is available via the Test Analysis view. Read on to learn up setting up, accessing, and navigating available resources.
90 days after the initial test execution, the report is completely removed from the Test Analysis view in Perfecto. This configuration is valid for all Perfecto clouds and is not subject to change. Consider saving your execution reports locally if you need them for a longer period of time, as follows:
- On the Report Library tab, click the report you want to view.
- When the report displays, click the download icon
 in the top right.
 - From the menu that opens, under Export to PDF, select Full report.
On this page:
Step 1 | Set up Smart Reporting
- Download the Repording SDK client for your programming languages and framework.
- Implement reporting by integrating the tool into your test, for Java, JavaScript, C#, Python, UFT, or Ruby.
Step 2 | Access the Test Analysis view
-
Log in to Perfecto at: https://<CQLab>.app.perfectomobile.com.
-
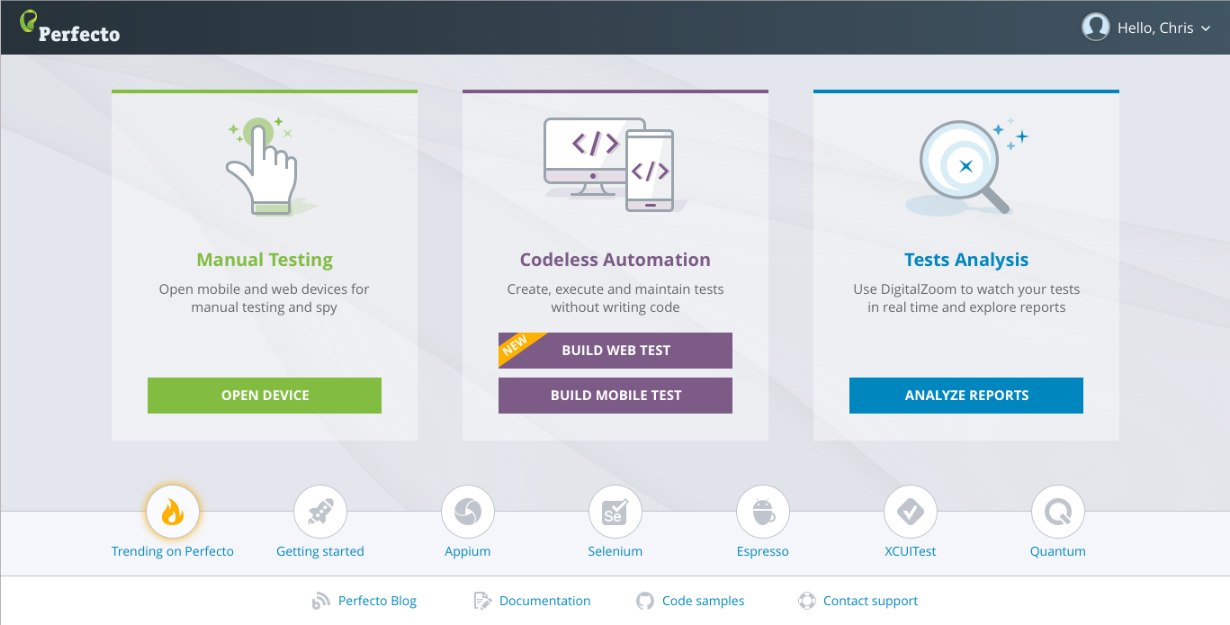
On the UI landing page, click Analyze Reports.
- Export the generated Execution Summary or Single Test report (optional) as:
- A PDF report
- JSON data that can be formatted (using the Public API)
Step 3 | View reports
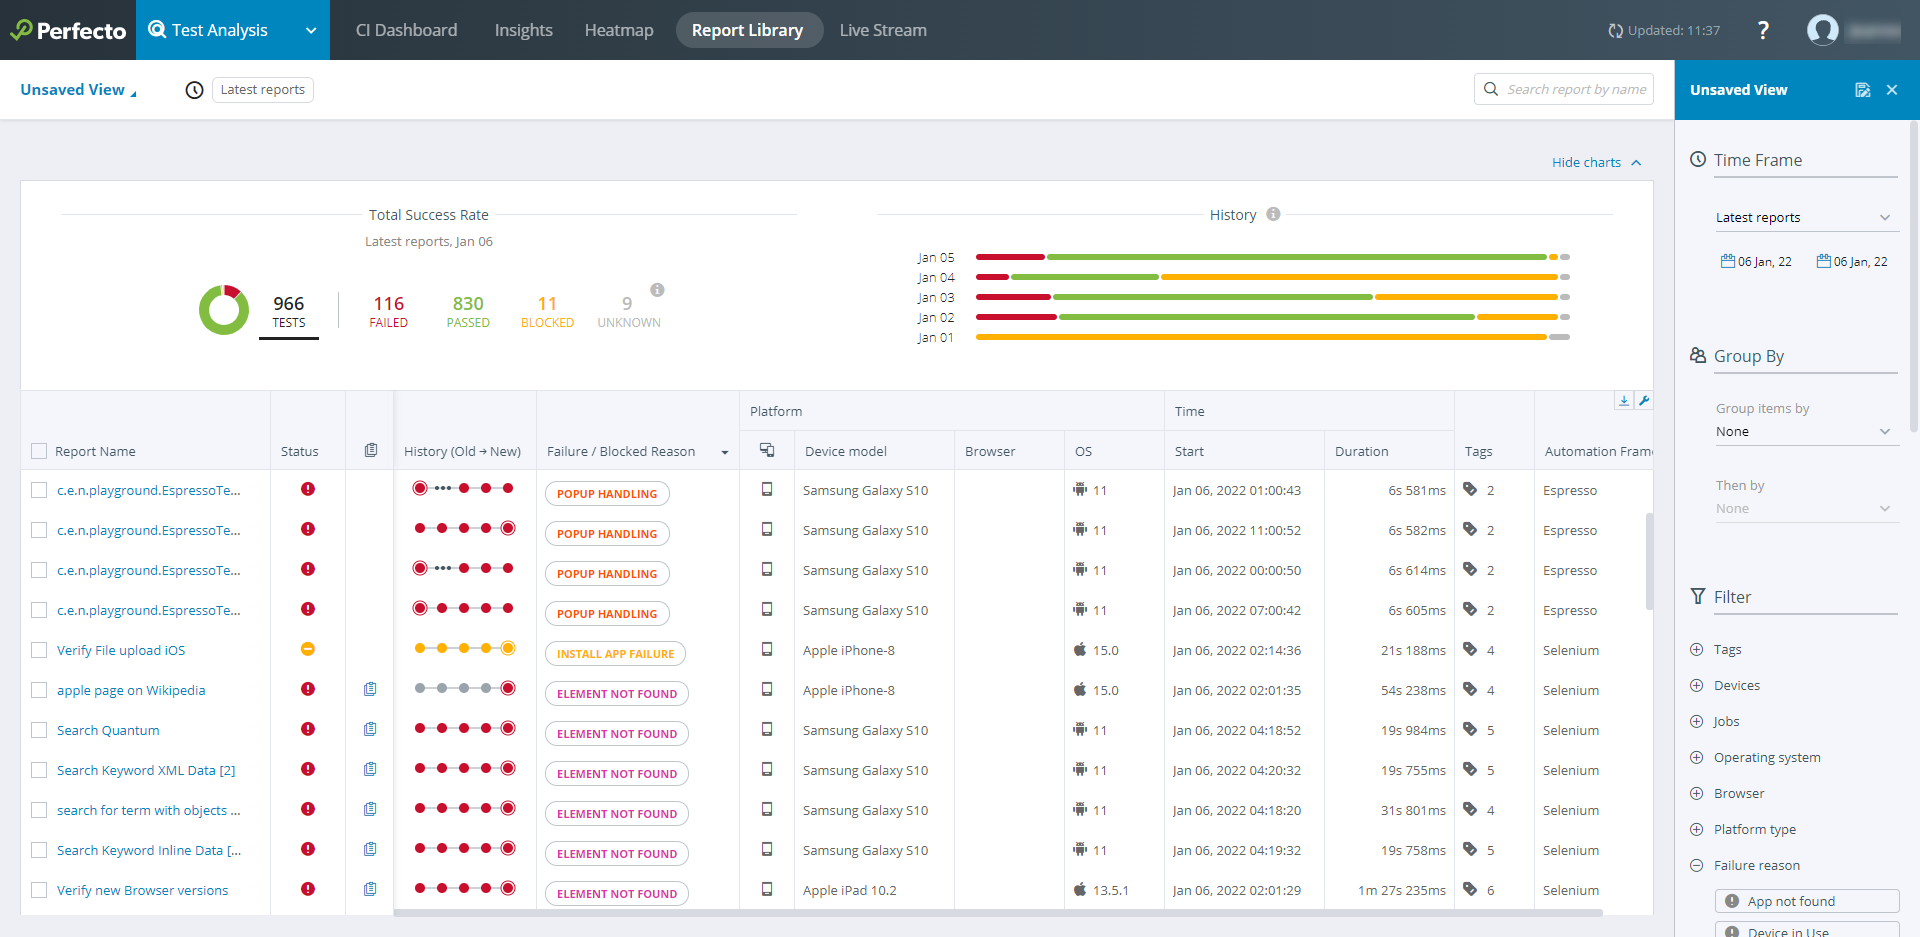
The Test Analysis view presents your test results on the following tabs that present different views of the result data:
- CI Dashboard: Displays the history of the test results, grouped based on the CI jobname identifier. Here, you can track your CI/CD pipeline and scheduled builds/jobs.
- Heatmap: Displays a graphic overview of different cross-sections of the test results. You can group test results by two levels of characterizations – devices or specific tags. The different groups are color-coded based on the distribution of passed or failed tests.
- Report Library: Displays a list of all single test reports for the Perfecto Lab, along with recorded videos and screenshots. You can filter the listing to focus on a set of tests with a particular tag or drill down to view the full report. The tags may be execution-level context tags or specific test tags. You can also export reports in PDF format or as JSON data.
- Live Stream: Displays a list of test executions currently in progress and allows you to stop one or more executions at once if needed.
In addition, you can drill down to view the Single Test Report (STR) for a specific test. You can also export the generated Execution Summary or Single Test report (optional) as:
- A PDF report
- JSON data that can be formatted (using the Public API)
The following pages provide more information on these tabs:
Step 4 | Group or filter reports
The data displayed on the Insights, Report Library, and Heatmap tabs is configurable: You can filter the data, group it (Report Library and Heatmap only), and save your settings as custom views.
To open the configuration pane:
-
At the top right, click CONFIGURE VIEW. The configuration pane opens on the right.
Filtering
You can filter the reports displayed based on any combination of the following parameters:
-
When the test was run. Under Time Frame, select a range of dates. The default is to only display tests run in the past 24 hours.
-
Specific test information:
-
Tags assigned to the tests
By default, only the first 8 tags are displayed. If more tags are available, you can view them by clicking + Select another tag.If less than 8 tags were used in the executions that ran during the selected time frame, the + Select another tag option is not available. -
Custom Field values assigned to the tests
-
Other parameters, such as:
-
Automation framework
-
Browser
-
Devices
-
Exception summary
You can also use this parameter to search for a string in the Exception summary column.
-
Failure reason
-
Job number
-
Jobs
-
Devices
-
Owner
-
Operating system
-
Operating system version
-
Performance incident
-
Platform type (to view only tests run on Mobile devices or Desktop Web devices)
-
Trigger type (CI/CD, Manual, Scheduled)
-
-
Grouping
You can group jobs and executions by the following parameters:
- Automation framework
- Browser
- Browser version
- Device ID
- Device model
- Exception summary
- Failure reasons (failed and blocked)
- Job name
- Operating system
- Operating system version
- Platform type
- Project name
- Project version
- Resolution of the device display
- Tags
- Test
- Custom Field values
You can select two levels of groupings, where the second grouping is applied within each group (by the first parameter).
When you select a grouping option in the Report Library, the Groups pane opens on the left. This pane shows the distribution of failed, blocked, and passed tests per group. You can filter the pane by different values (name, percentage of failed or blocked tests, and number of failed or blocked tests) and click a group to drill down to the underlying executions. If you click a group, the Report Library refreshes to show only the related executions.
Custom views
After selecting group or filter parameters (see below) to focus on a subset of available test reports, you can save these settings as a custom view. A custom view allows you to:
- Understand the progression of the test results by viewing sets of comparable test reports but from different time frames.
- Share a focused view with other users.
To save the set of selected parameters as a custom view:
- In the pane on the right, in the header, click the save icon
 .
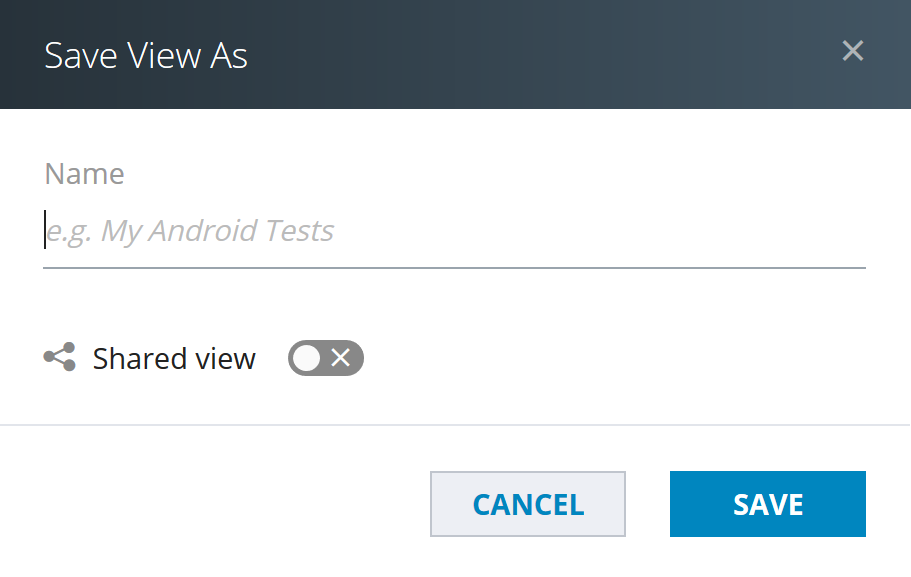
. - In the Save View As dialog box, do the following:
- Enter a name for the view.
- (Optional) If you want others to be able to access this view, turn on Shared view.
-
Click Save.
To switch to a custom view:
-
In the upper left, expand the list to view existing custom views you created (My views), views that other users created and shared with you (Views shared with me), and views predefined by Perfecto (System views).

To delete or share a custom view:
- In the right pane, click the menu icon
 .
. - Select Delete or turn on Shared view.
Step 5 | Analyze test results
Your last step in working with reports involves analyzing the results and taking actions to fix the issues discovered. Continue with Analyze test results.
Video tutorial
How to add reporting to your test and view the resulting reports: