When using a Continuous Integration (CI) tool, for example Jenkins, each test set is assigned a job name and, usually, a job number. The CI Dashboard displays an overview of the history of the tests listed by their job name.
Watch this short video for a demonstration of how to navigate the CI Dashboard view.
For more information, expand the following sections.
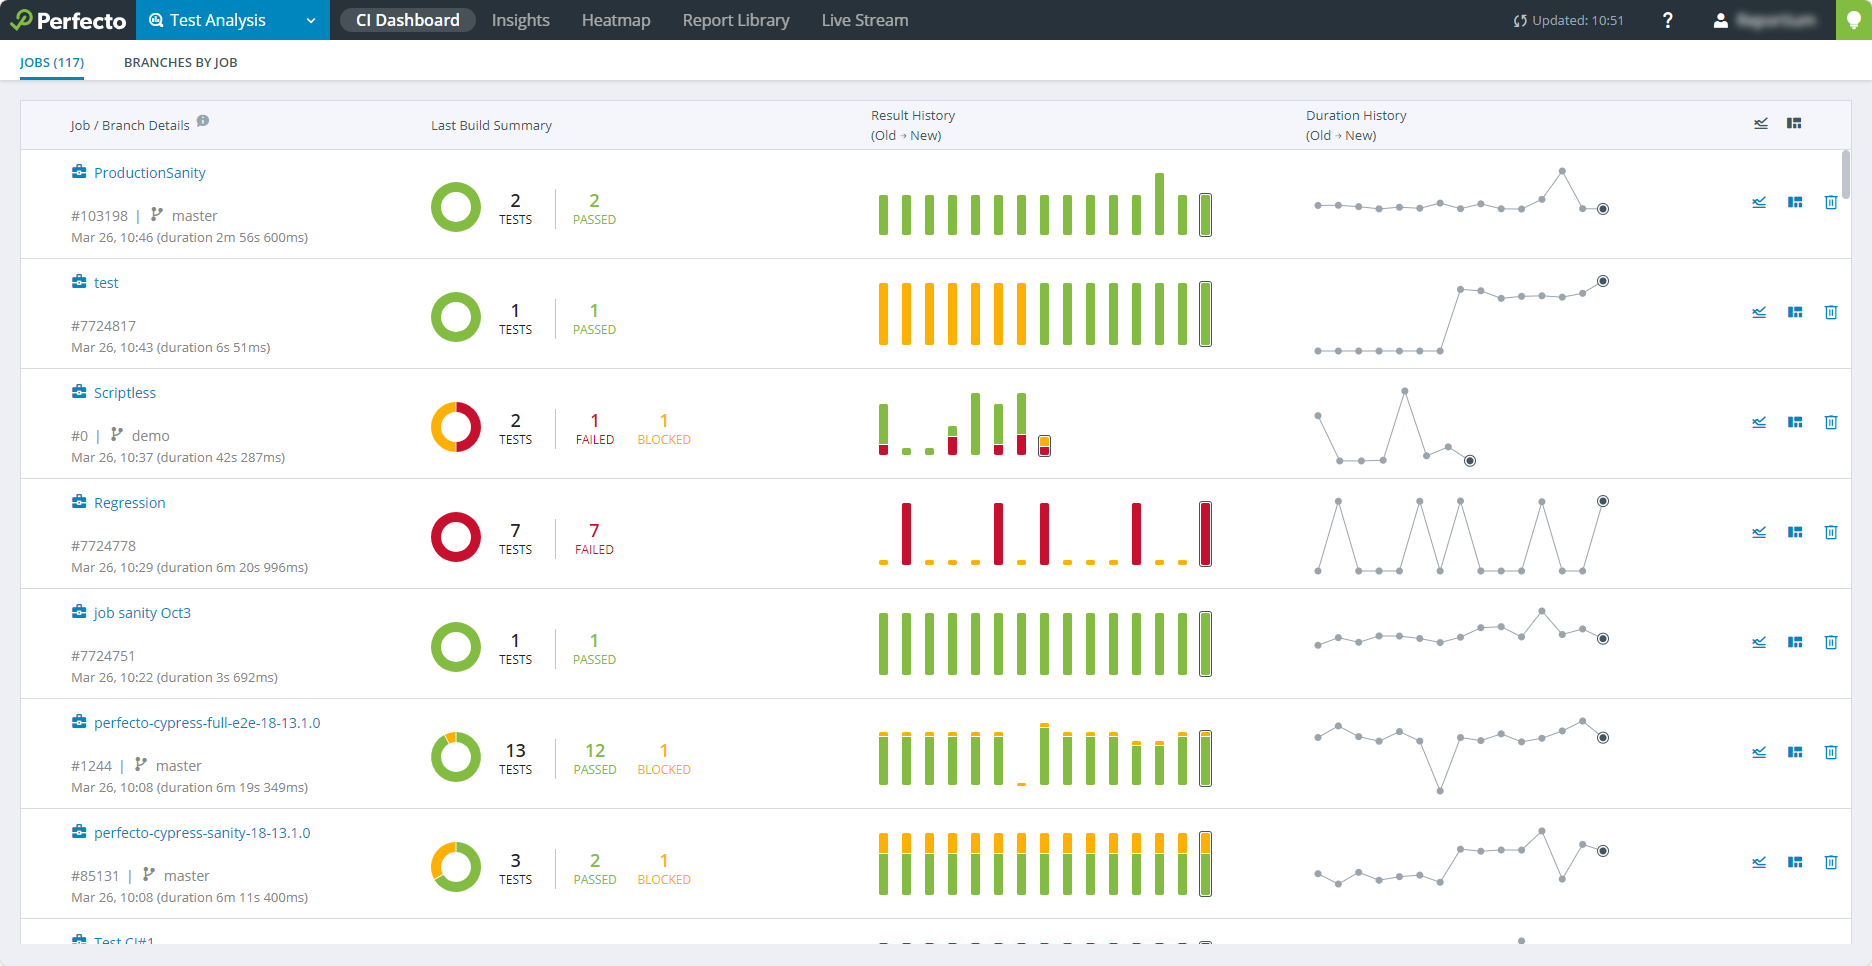
The Jobs tab shows the following information:
- The Job Name and the details of the selected test run.
- A statistical overview of the selected test run results:
- Number of tests included
- Number of tests that reported "passed"
- Number of tests that reported "failed"
- Number of tests that did not report a final status or indeterminate result
- A set of bars that (graphically) represent the history of the job's test runs, where each bar represents the distribution of the test results for the particular run
- A line graph that represents the duration history of the job's test runs, where each node on the line represents the duration of the particular run.
Clicking information in the Last Build Summary column or a bar in the Result History column opens the report in the Report Library. You can also open the report in a separate tab or window. Select the information in the Last Build Summary column or a bar in the Result History column and right-click to select an option to open the report in a new tab or window. Clicking an icon in the right-most columns opens the Insights view (![]() ) or HeatMap (
) or HeatMap (![]() ) for the job/branch.
) for the job/branch.
To delete a job:
-
On the very right of the relevant row, click the delete button
 .
. Clicking this button deletes the entire job, not only the branch.
History information
The Result History bars and Duration History nodes are coordinated. Each bar represents the same job as the corresponding node. Moving the pointer over a bar or node displays a tooltip with the following statistic information:
- Job Number
- Date and time that the test run was executed
- Duration of the test run (when moving the pointer over the duration node)
- A statistical overview of the run (when moving the pointer over the history bar)
- Heatmap icon
 to drill down to the Heatmap for this build
 - Insights icon
 to drill down to Insights for this build
The statistical overview shows the actual test results for the test run.
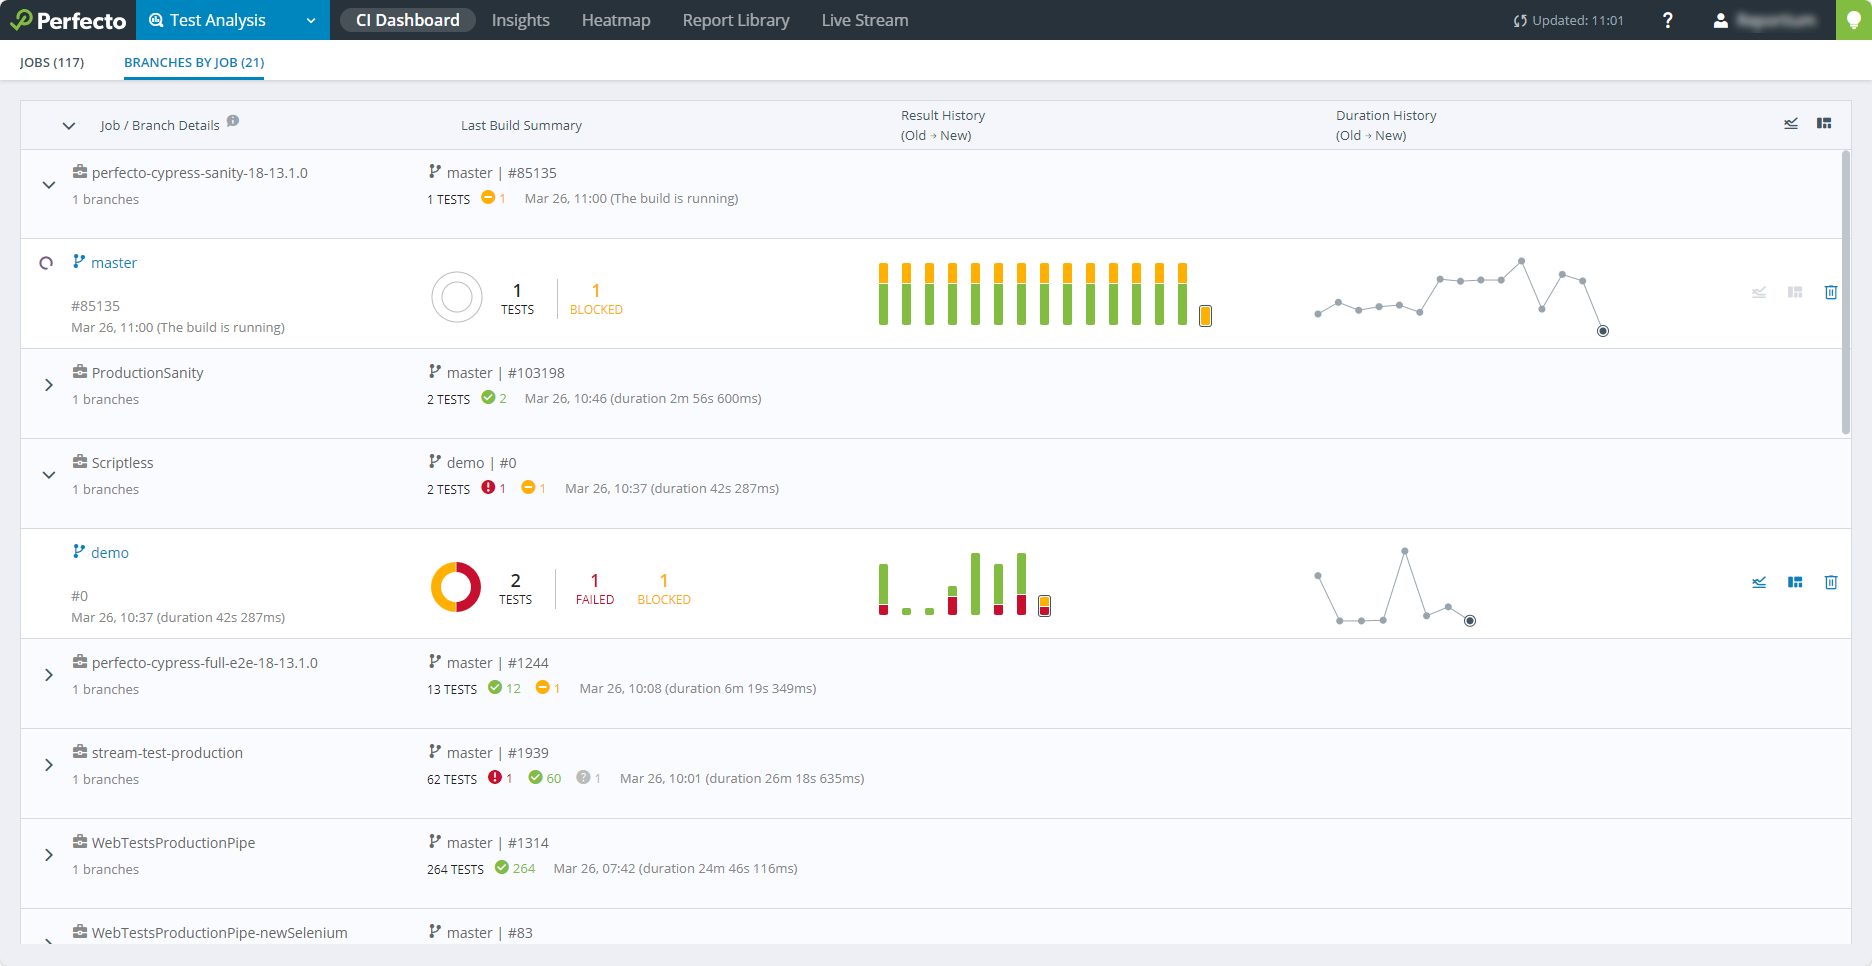
Each CI Job (see above) can also be divided into different branches that may, for example, define a different flavor of test for the features under test. If the tester declared a test run to be associated with a particular branch (by using the withBranch method or with the reportium-job-branch command-line parameter), then the job and its branches are displayed in the Branches by Job tab.
The tab displays a separate line for each job that includes:
- The total number of branches in the job
- Summary of the status of the most recent branch run
Clicking a row opens a list of all branches' history overview (similar to the job history overview described above), showing one line for each branch of the job.
To delete a job:
-
Click a row to expand the related branches.
-
On the very right of the relevant row, click the delete button
. Clicking this button deletes the entire job, not only the branch.