The Report Library presents a detailed overview of the tests run within a selected period of time, including:
- Statistical information for all listed tests
- Historical breakdown of when tests failed
- Table of all selected tests, including information on the parameters of the test run
For information on how to filter and group the view, see Focus on what's important to you.
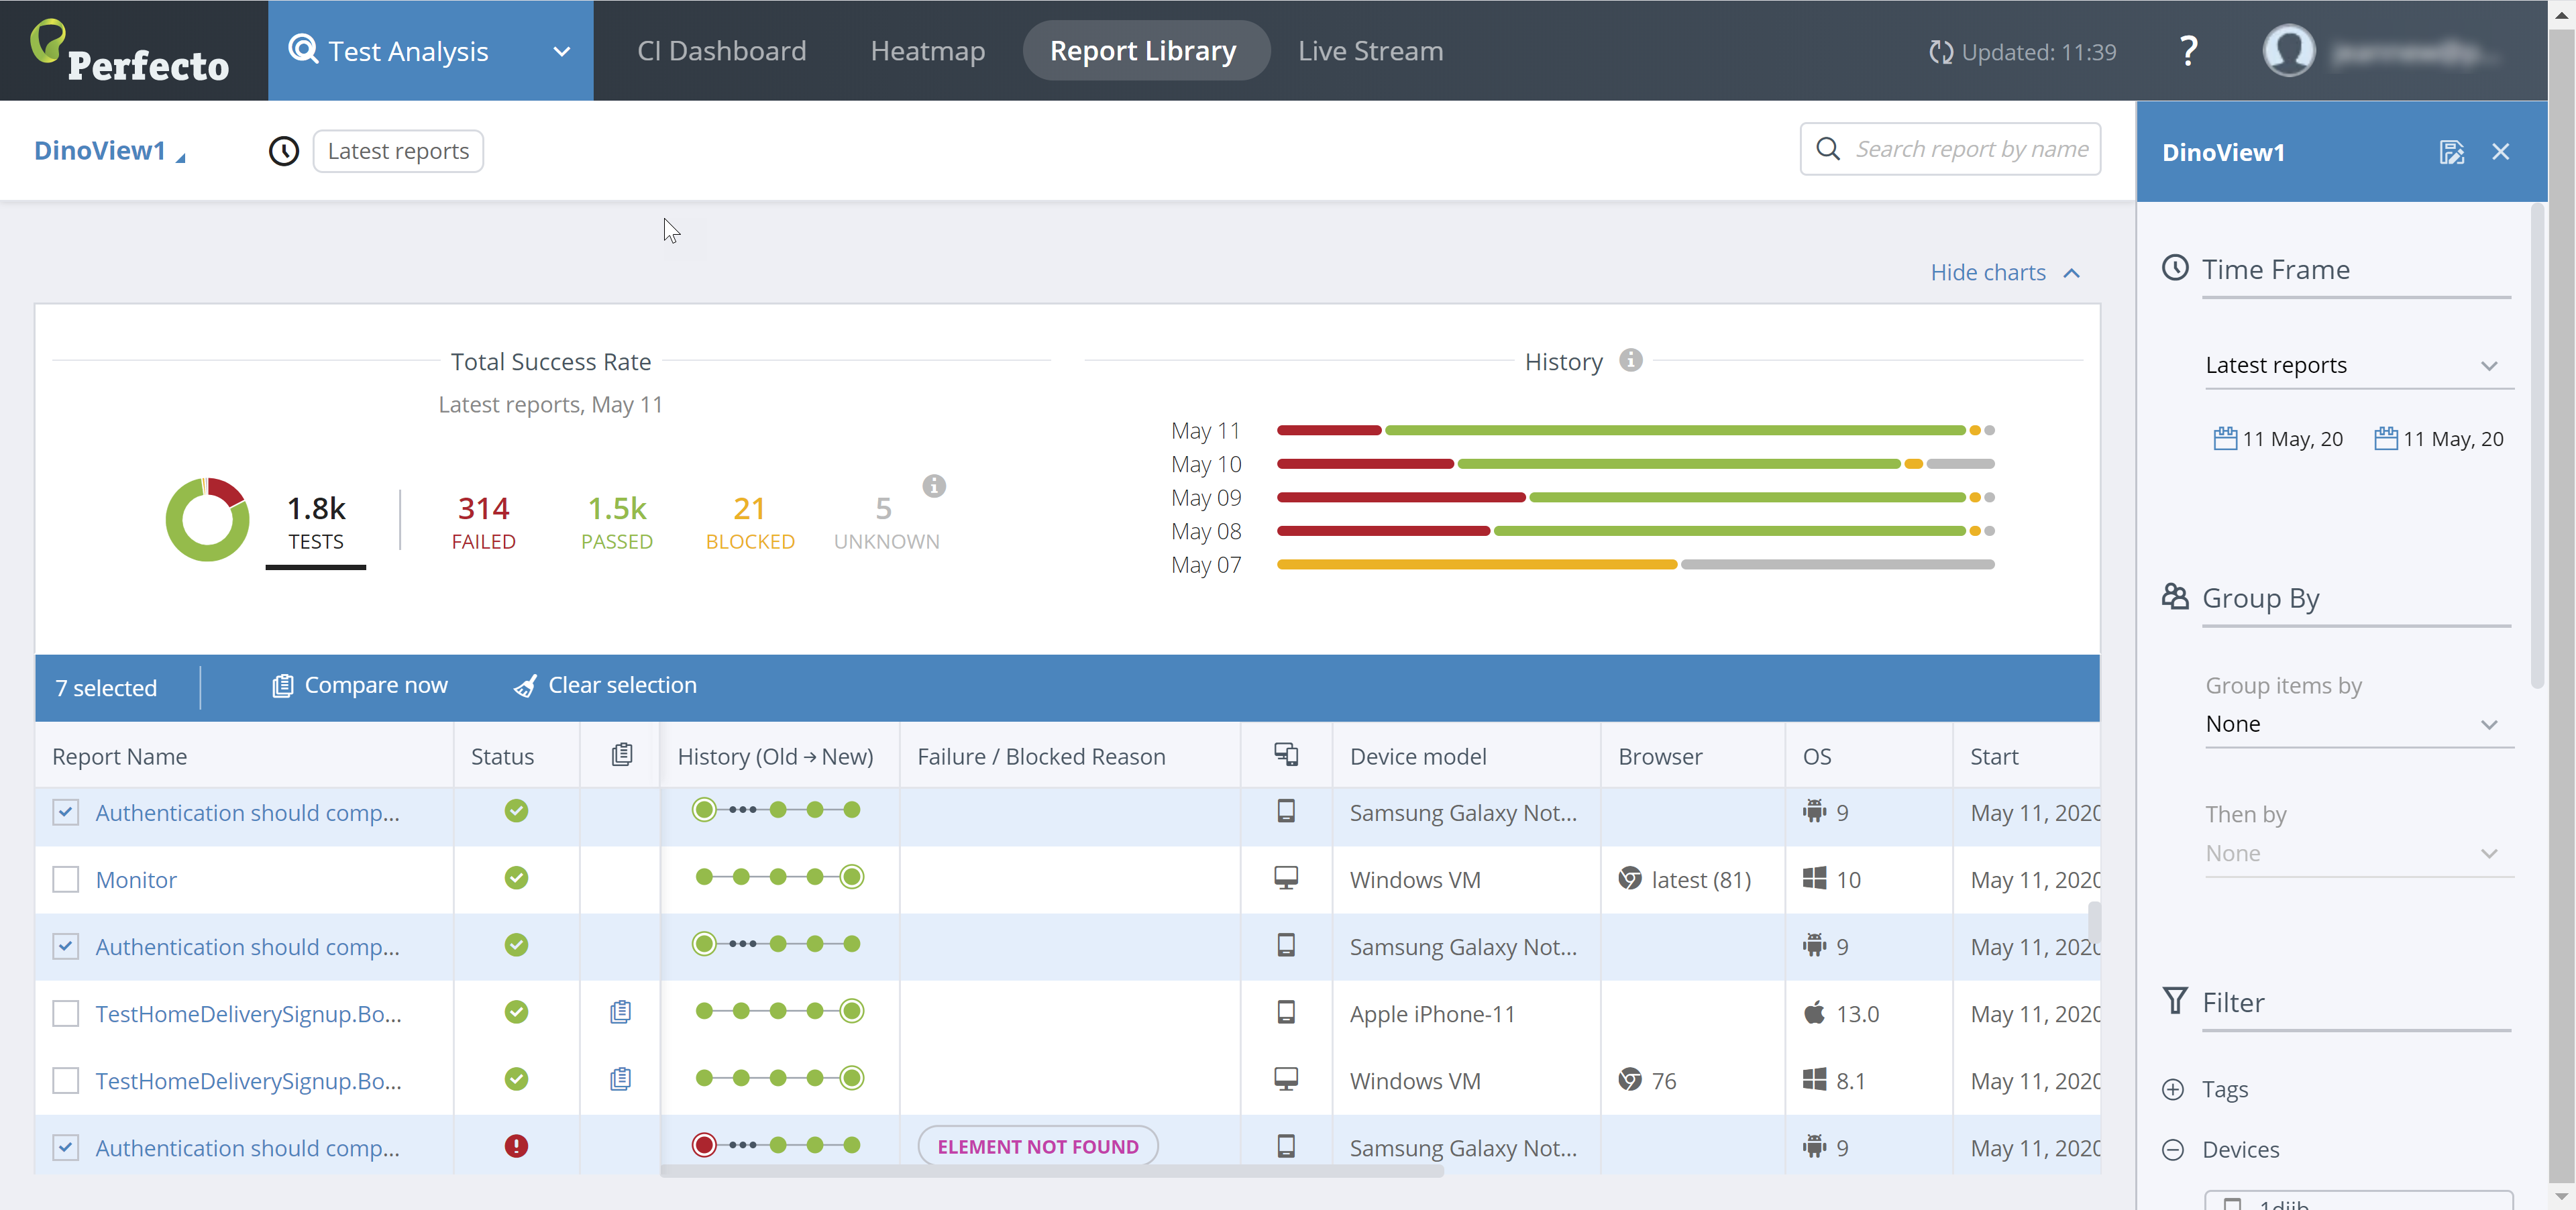
This figure shows the Report Library grouped by device model.
On this page:
Overview
The following sections explain how to read and use the different parts of the Report Library view.
The header bar across the top of the display (just below the top-level Test Analysis tabs) displays:
- Saved view selector - Lists all views available to you. This includes views you saved yourself, views someone else shared with you, and predefined system views. A view is based on a selection of group and filter parameters.
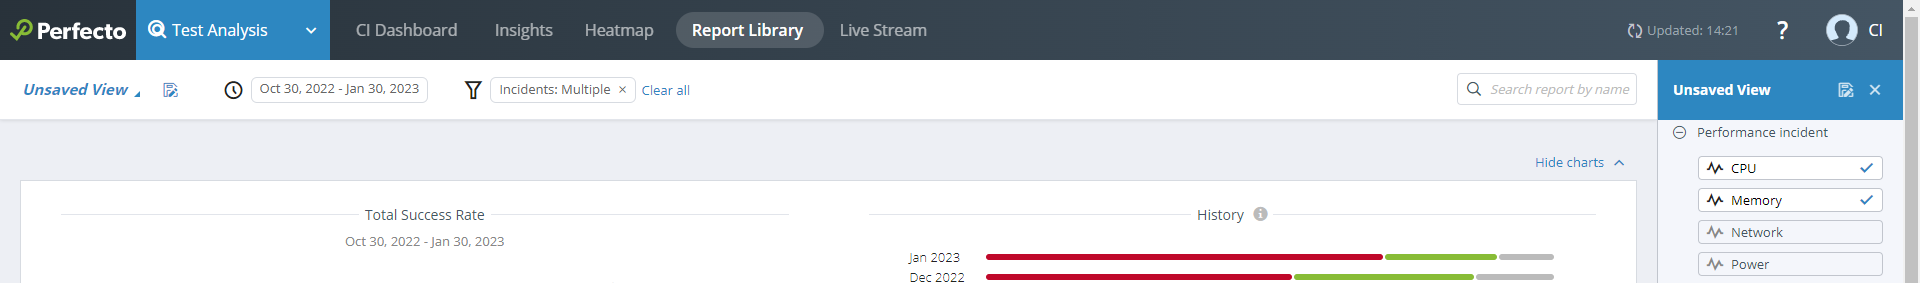
- Active filters - Lists all of the currently selected filters and groupings for the list. For example, if the Report Library is filtered by CPU and Memory performance incidents (using the Filter pane on the right), Incidents: Multiple is displayed next to the filter icon
 .
. - Search field - Lets you search for keywords to display only tests with names that match the entered term.
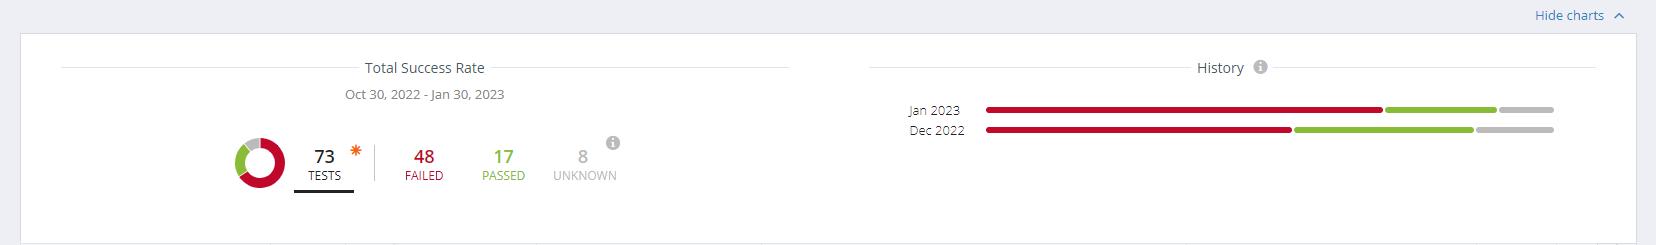
The section just below the header bar includes statistical views of the listed tests:
- Statistical Overview shows general statistics of the currently listed tests, split into the number of passed, failed, blocked, and other tests. In addition, if Perfecto has detected performance issues, an incident indicator
 is displayed next to the total number of tests. Moving the pointer over the indicator displays a tooltip with the overall number of incidents detected. You can click the tooltip to view all reports with performance incidents in the Report Library.
 - Run History provides an overview of dates when tests were run. The view is color-coded to show the number of passed, failed, blocked, and other tests for a particular date.
Use the Hide charts/Show charts link above the charts to toggle the display.
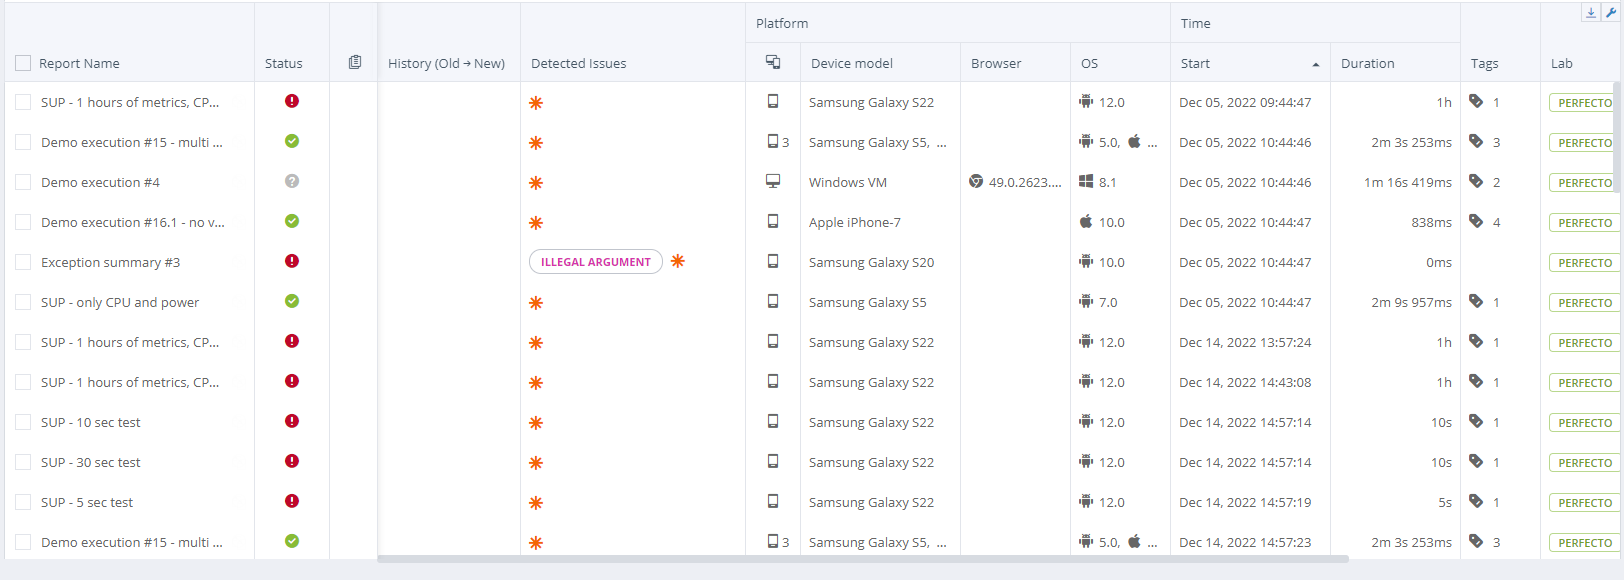
For all test reports, the table in the Report Library view lists the information included in the following table.
| Table column | Sub-column | Description | Displayed by default |
|---|---|---|---|
|
Report Name |
|
The script name as supplied in the Perfecto ReportiumClient (For Scriptless Web only) Indicates the test name (not the flow name). Use this column to:
|
Yes |
|
Status |
|
The final status reported by the specific test run. The test status is one of: Passed, Failed, Blocked, Unknown. |
Yes |
|
Cross Report |
|
Indicates if the test report is part of a cross-report. |
Yes |
|
History |
|
Indicates when this test run was executed relative to other runs of the same test. (See below for more detail.) |
Yes |
| Detected issues |
|
Displays details on detected issues. |
Yes |
| Detected issues |
Failure reasons |
Indicates a reason detected, either automatically by Smart Reporting heuristics or by the testers |
|
| Detected issues |
Vitals |
If performance vitals are turned on in your cloud and Perfecto has detected performance issues, this column displays an incident indicator Performance incidents can be absolute or relative in nature. Absolute incidents include the time an incident occurred. Relative incidents alert to a deviation (an increase) that was calculated based on the last 10 executions of the same automation test. Clicking a link in the tooltip opens the single test report (STR). For absolute incidents, this synchronizes the related step in the test flow (on the left) with the exact point on the timeline of the video and vitals graph (on the right). For more information, see View device or application vitals. |
|
| Platform |
|
Indicates if tests were executed on Mobile or Web devices. May include an indication of the number of devices executed on. |
Yes |
| Platform |
Form factor |
Icon that identifies if the testing device was a Mobile or Desktop Web device. |
Yes |
| Platform |
Device model |
List of devices used in the test, with each device separated by comma. |
Yes |
| Platform |
Device ID |
For mobile devices, provides the ID number of the testing device. |
No |
| Platform |
Browser |
Browser version for Web devices. |
Yes |
| Platform |
OS |
List of operating system versions, coordinated with devices list. |
Yes |
| Platform |
Resolution |
List of device resolutions, coordinated with devices list. |
No |
| Job |
|
Details of the CI Job reported for this test. |
No |
| Job |
Name |
Job name as reported in the execution context. |
No |
| Job |
#Number |
Job number as reported in the execution context. |
No |
| Job |
Branch |
Job branch as reported in the execution context. |
No |
| Job |
|
Provides details of when test was run and its duration. |
Yes |
| Job |
Start |
Start time of the test run. |
Yes |
| Job |
Duration |
Duration time of the test. |
Yes |
|
Tags |
|
Indicates the number of tags associated with the test run. |
Yes |
| Failed / blocked exception |
Provides information on the exception that caused the test to fail. You can copy the exception by moving the pointer over the respective field and clicking the copy icon |
||
| Failed / blocked exception |
Exception Summary |
A cleaned-up version of the exception that occurred. To extract the code of the exception, Perfecto looks for specific strings in the stack trace. You can search this column by using the Exception summary field in the Configuration pane on the right. Perfecto searches across all available reports, not only the ones currently loaded in the UI. |
No
|
| Failed / blocked exception |
Exception Details |
The full text of the exception that occurred. This information should help you pinpoint the exact location in your test case that threw the exception so that you can go back and fix it. This may well be the most important column for you to work with. |
No |
|
Lab |
|
Indicates if test was run in a Perfecto Lab. |
No |
|
Automation Framework |
|
Indicates the automation framework used by the automation script. For tests run manually, this column displays the value Interactive. For tests run through Scriptless Web, the value is Scriptless Web. For tests run through AI Scriptless, the value is AI Scriptless. In all other cases, the value displayed is the name of the respective automation framework, such as Selenium, XCUITest, or Cypress. |
No |
|
Trigger Type |
Indicates if the test was run as part of a development cycle, manual test, monitoring, user tests, and more. The possible values are: Manual (tests initiated manually by the user), Scheduled (jobs initiated by the scheduler), and CI/CD (jobs initiated by external CI/CD tools/command line interface). | No | |
|
Environment Name |
(For Scriptless Web only) Indicates the environment where the test was run. A project can have multiple environments. The environment name shows the environment selected for the particular test run. |
No |
|
|
Environment URL |
(For Scriptless Web only) Indicates the environment link or website where the test was run. |
No |
|
|
Flow |
(For Scriptless Web only) Indicates the test flow selected for the particular test run. A flow is a version of a test created by enabling or disabling steps or changing the sequence of steps. |
No |
|
|
Dataset |
(For Scriptless Web only) Indicates the dataset selected for the particular test run. Datasets let you run the same test flow using different data. |
No |
|
|
Test Index in Job |
(For Scriptless Web only) Indicates the test number or sequence of the test in the associated job. A job can include multiple tests. |
No |
Test history information
The history graph in the History column shows a series of nodes. Each node represents a single run of the test.
The History mechanism defines test similarity by test name and execution capabilities. If there is a difference in either the name or the capabilities (for example, the osVersion capability is included in one test run but not in another), the tests are considered 'not similar'. As a result, they are not connected in history.
The test run whose details are described in this report is displayed as a double-ring in the history (![]() ). This makes it easier to identify when this test run was executed relative to other test runs. When reading the history graph, keep in mind that:
). This makes it easier to identify when this test run was executed relative to other test runs. When reading the history graph, keep in mind that:
- The latest test run is always represented by the right-most node.
- No more than five nodes appear in the history graph. If the specific run occurred prior to the five latest runs, the graph shows a break represented by three dots (
 ).
). - The color of the node represents the test result status for that particular run, where green means 'passed', yellow means 'blocked, and red means 'failed' (
 ).
). -
Move the pointer over a node to display a tooltip with details for that run.
-
Arrows around an icon (
 ) identify test runs with scheduled retries that have been collapsed into a single test report.
The Scheduled Retries is turned off by default. To turn it on in your cloud instance, contact Perfecto Support.
For a test to be considered a retry, it must share the same parameters and CI job name and number or be part of the same execution. Perfecto does not list a test that is considered a retry in the table and does not take it into account when calculating statistics. Only the last test in a retry series makes it into the statistics. For more information, see Scheduled retries in the Single test report (execution report) article.
Failure/blocked reason
Smart Reporting is designed to provide the test data from your test runs, but also to allow you - the tester or the test manager - to better understand the results of your tests. If your test ends with a success status, you know that all is well. However, when a test fails, Smart Reporting may analyze the test data and provide a failure reason that indicates what caused the test to fail.
The Smart Reporting system provides functionality that supports generating this failure reason classification, either:
- Manually by the test script, based on the stage in the script execution when the test is determined to have failed.
- Automatically. Smart Reporting analyzes the entire test information and generates the reason based on a heuristic classification. For more information on Perfecto's root cause analysis (RCA) approach, see Insights.
In either case, the failure reason is color-coded (where green means 'passed', yellow means 'blocked, and red means 'failed') and displayed in the table of the test reports, in the Detected Issues column, to allow a quick overview of the different failed tests. If a test fails without reporting a failure reason, the Status column will show a red icon, but the Detected Issues column will be blank.
The Smart Reporting system automatically identifies instances when the test failed before it was able to start. When these failures occur, the report is marked with a blocked failure reason (that will appear in the table as the Failure Reason, color of reason in yellow) and the Status column will show a Blocked status (![]() ). These blocked failure reasons are completely controlled (failure reason text and color) by the Smart Reporting system. Some examples of blocked failure reasons include:
). These blocked failure reasons are completely controlled (failure reason text and color) by the Smart Reporting system. Some examples of blocked failure reasons include:
-
Device in use
-
Device not connected
-
Device not found
Tags column
You can move the pointer over the tag icon in the Tags column for a specific test to display a tooltip that lists all tags associated with the test.

This tooltip is an active tooltip. Clicking a tag filters the table to show only tests associated with that tag.
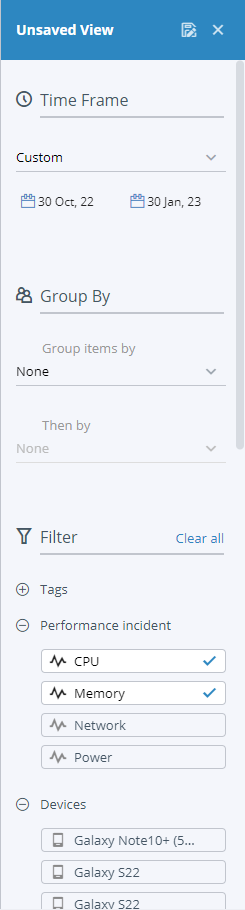
Use the pane on the right to:
-
Filter the list of displayed test runs, to limit the list to those that comply with the selected parameters or time frame.
-
Create groups of test runs to display in the groups overview.
For more information on the right pane, see Access and navigate the Test Analysis UI.
Focus on what's important to you
The following sections explain how you can group and filter information in the Report Library to narrow your focus on the details you need to see.
When the Report Library includes a wide variety of tests, you can use the Search field at the top to focus on the set of tests you are interested in.
To search reports:
- Start typing the name (or any sub-string of the name). Smart Reporting presents a list of suggested available test names.
-
Do one of the following:
-
Select the test name from the list of suggestions.
-
Complete typing the requested name and press enter.
-
The list refreshes to display only tests with names that match the search term. If no tests match the search term, a 'No reports found' message appears.
You can use the Statistical Overview area to focus on reports with a selected final status:
- Click a counter (Failed, Passed, Blocked, Unknown) to filter the list to show only those reports with the selected status.
- Click Tests to list all test reports.
For example, if 26 tests have a status of Blocked, clicking the Blocked counter filters the list to display only the 26 reports that are currently blocked.
The table may show information that is not relevant at the moment. You can configure it to hide or show columns as needed.
To configure columns:
-
Click the pliers icon
 above the table to display a menu of columns you can configure to appear in the Report Library table.
Custom fields defined in a test appear as column names at the end of the list.
-
Select the check box next to a column you want to include in the table or clear the check box of columns you do not want to display.
The Report Name and Status columns are not configurable. They are always visible.
Use the custom fields defined at the different context classes or as part of the JVM command line parameters (with CI) to refine your results beyond built-in filter categories and tags. Custom fields are <name, value> pairs, so they allow for an additional level of segregation. You can filter and group by custom fields. In addition, you can add a custom field as a column to the report table (see Configure columns).
To filter by custom fields:
- In the right pane, under Filter, click Add filter group and select a value from the list. You may need to scroll down to find the field you are looking for.
The custom field is added as a filter category. - From the list that opens below the custom field, select a value and whether you want to include or exclude this value.
The list of reports refreshes to show the updated filter settings.
To group by custom fields:
- In the right pane, under Group By, select the required custom field from the list.
Use the built-in filter categories to better focus the analysis of your test results by filtering the tests to the subset of interest. For example, you can filter by performance incident indicators, such as CPU or Memory, by device make and model, job, or operating system, by browser or platform type, by failure reason or job number, to name just a few.
To filter by built-in categories:
- In the right pane, under Filter, expand any filter category and select one or more parameters.
The following figure shows the table filtered by performance incident, showing all incidents pertaining to power usage. Note the indication of the filtering in the right pane.
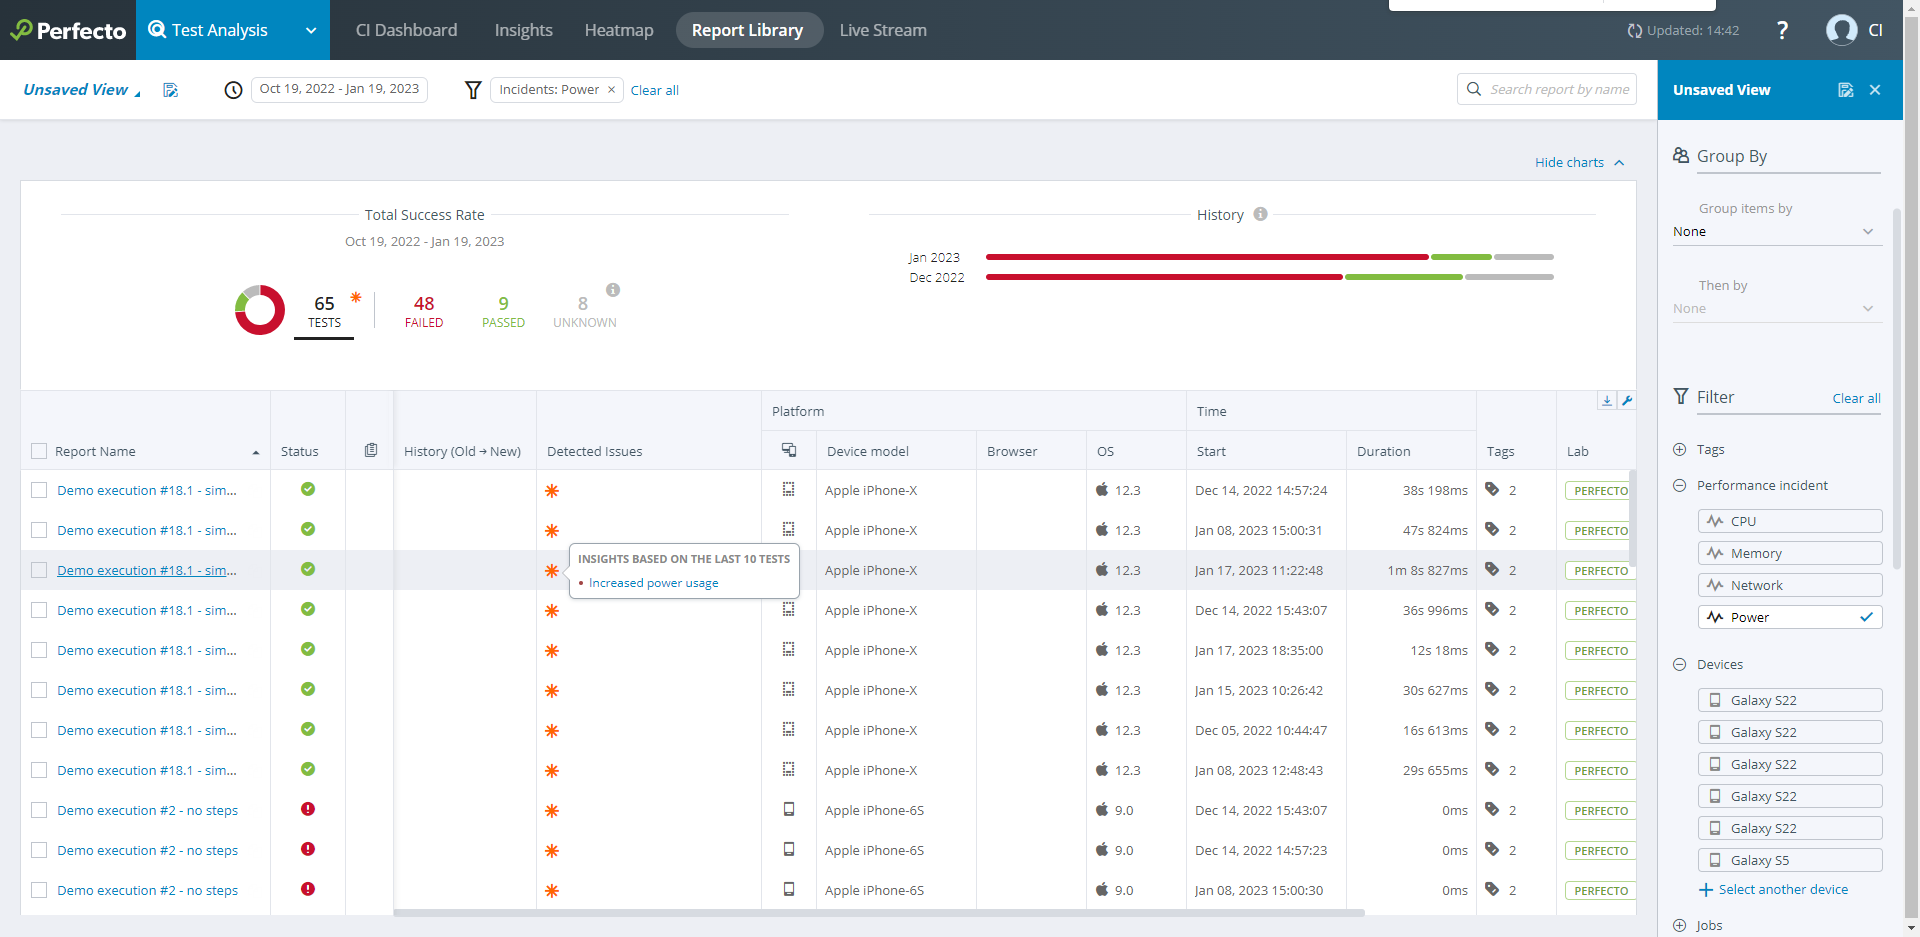
Best Practice: For greater flexibility and more refined filter and group results, consider the use of custom fields.
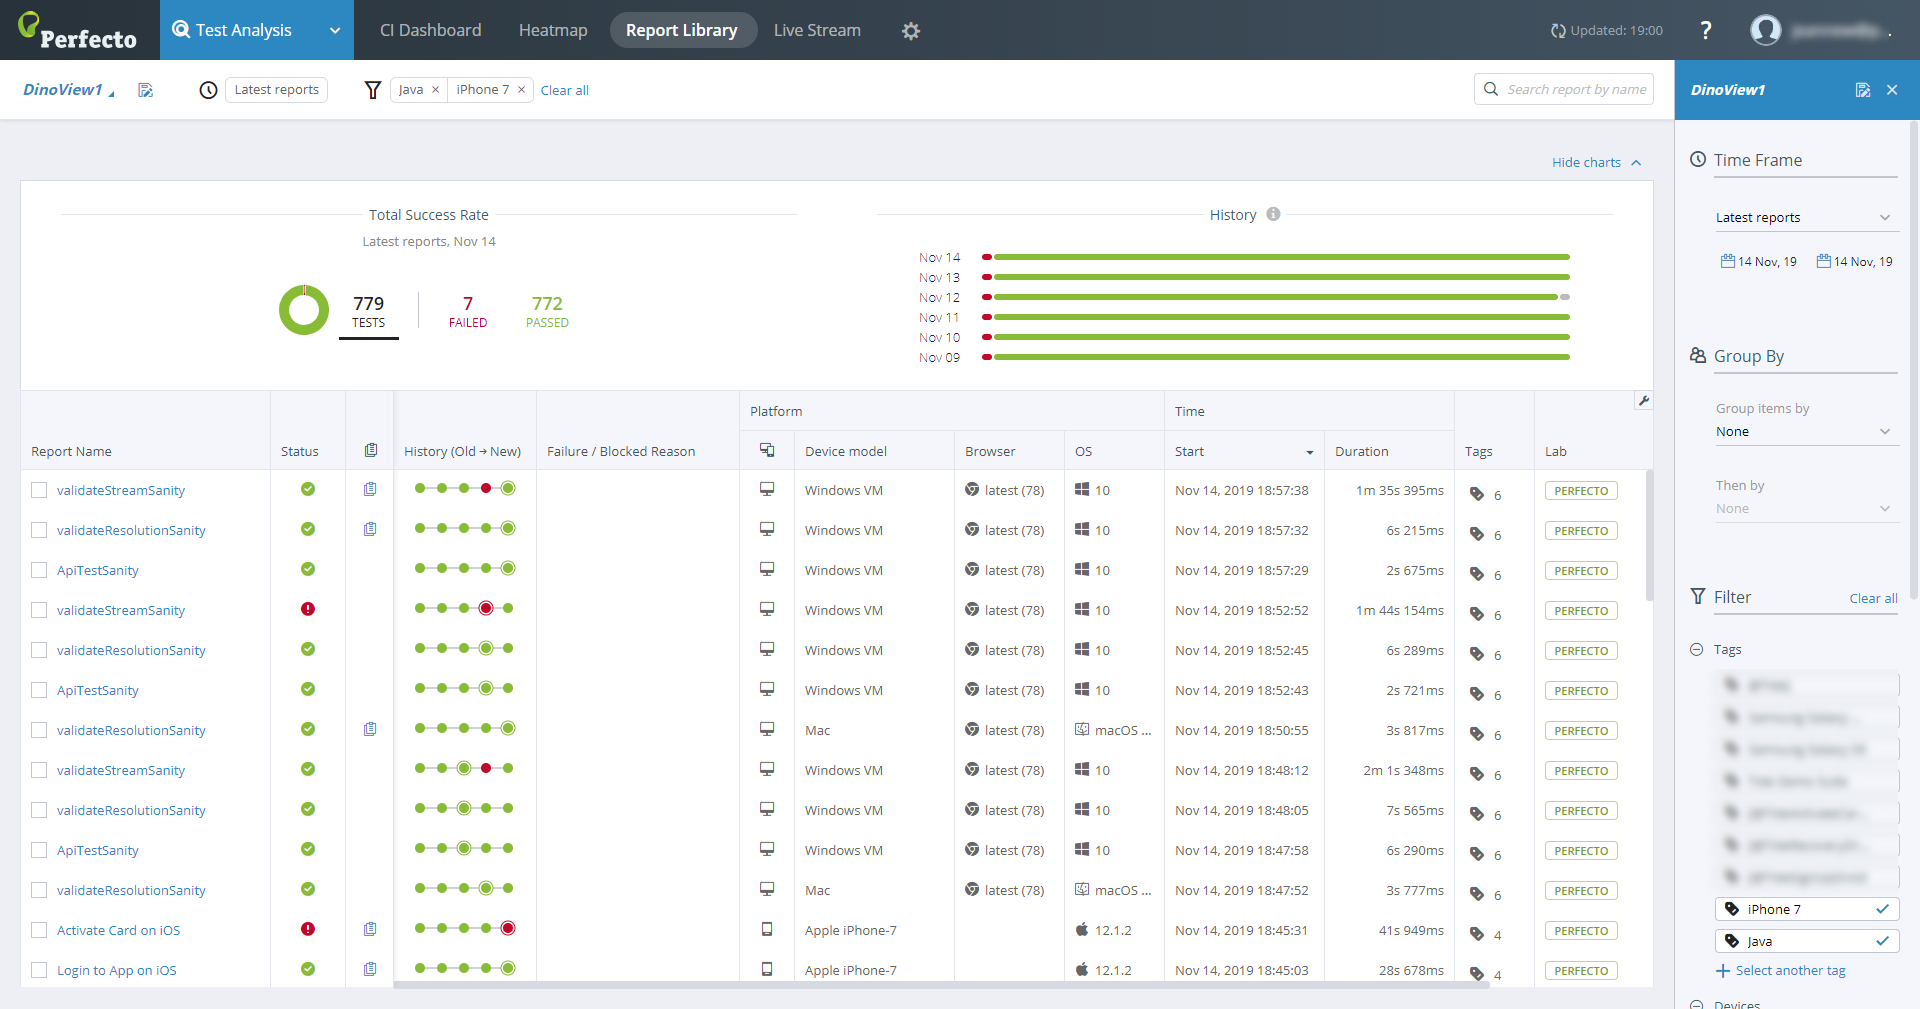
Use the tags defined by the different context classes to better focus the analysis of the test results by filtering the tests to the subset of interest.
See Tag-driven reports (RTDD workflow) on how to optimize your test tags for efficient test analysis.
To filter by tags, do one of the following:
- In the Tag column, click the tag icon. In the tooltip that displays, click the tag you want to filter by.
- In the right pane, under Filter, expand the Tags section and select one or more relevant tags.
The following figure shows the table filtered by the tags iPhone 7 and XCTest. Note the indications of the filtering in the right pane.
Use the Jobs filter in the right pane to focus your search on specific jobs.
To filter by jobs:
-
In the right pane, under Filter, expand the Jobs section.
-
Do one of the following:
-
In the Search field, enter a full or partial job name. For example, typing "test" in the search box brings up all jobs that include the word "test" in their name.
When using the Search field to filter, you cannot use any other job filter. -
Click Select another job to search for a job and add it as a filter. The job names listed below the Search field are based on your previous searches. You can select as many jobs as needed.
The corresponding report details appear in the left pane.
-
Update multiple failure reasons
Perfecto lets you update the failure reason for up to 1000 reports at once. Such a bulk update is helpful if several reports failed for the same reason. Applying the same failure reason to such reports enhances failure analysis and eases the investigation.
Watch this short video to see how to perform a bulk-update. Detailed steps follow.
If you only need to update the failure reason for a single report, you can do this in the Single Test Report.
To update multiple failure reasons:
-
Click the Failed category to display the list of failed tests.
-
On the toolbar that appears above the table, click Set failure reason.
-
From the list that opens, select the failure reason to set.
-
Confirm the selection.
Export content to a CSV file
You can export the content of the Report Library to a comma-seperated values (CSV) file based on the selected filter parameters. For example, if you have selected a filter that includes 1,000 tests, the resulting CSV file will include:
-
An entry for each of these tests (while the Report Library may only display 50 of these tests at once)
-
All available columns (and not only the columns displayed in the Report Library)
-
Additional columns, such as owner, project name, and project version
-
The start time in UTC
-
Columns with multiple values (concatenated by comma), such as tags or the platform or device ID for tests executed on multiple platforms or several devices
Watch this short video to see how it works. Detailed steps follow.
For information on downloading a CSV file through the API, see Report Library CSV file.
To export to a CSV file:
-
Click the download icon
 above the table.