The
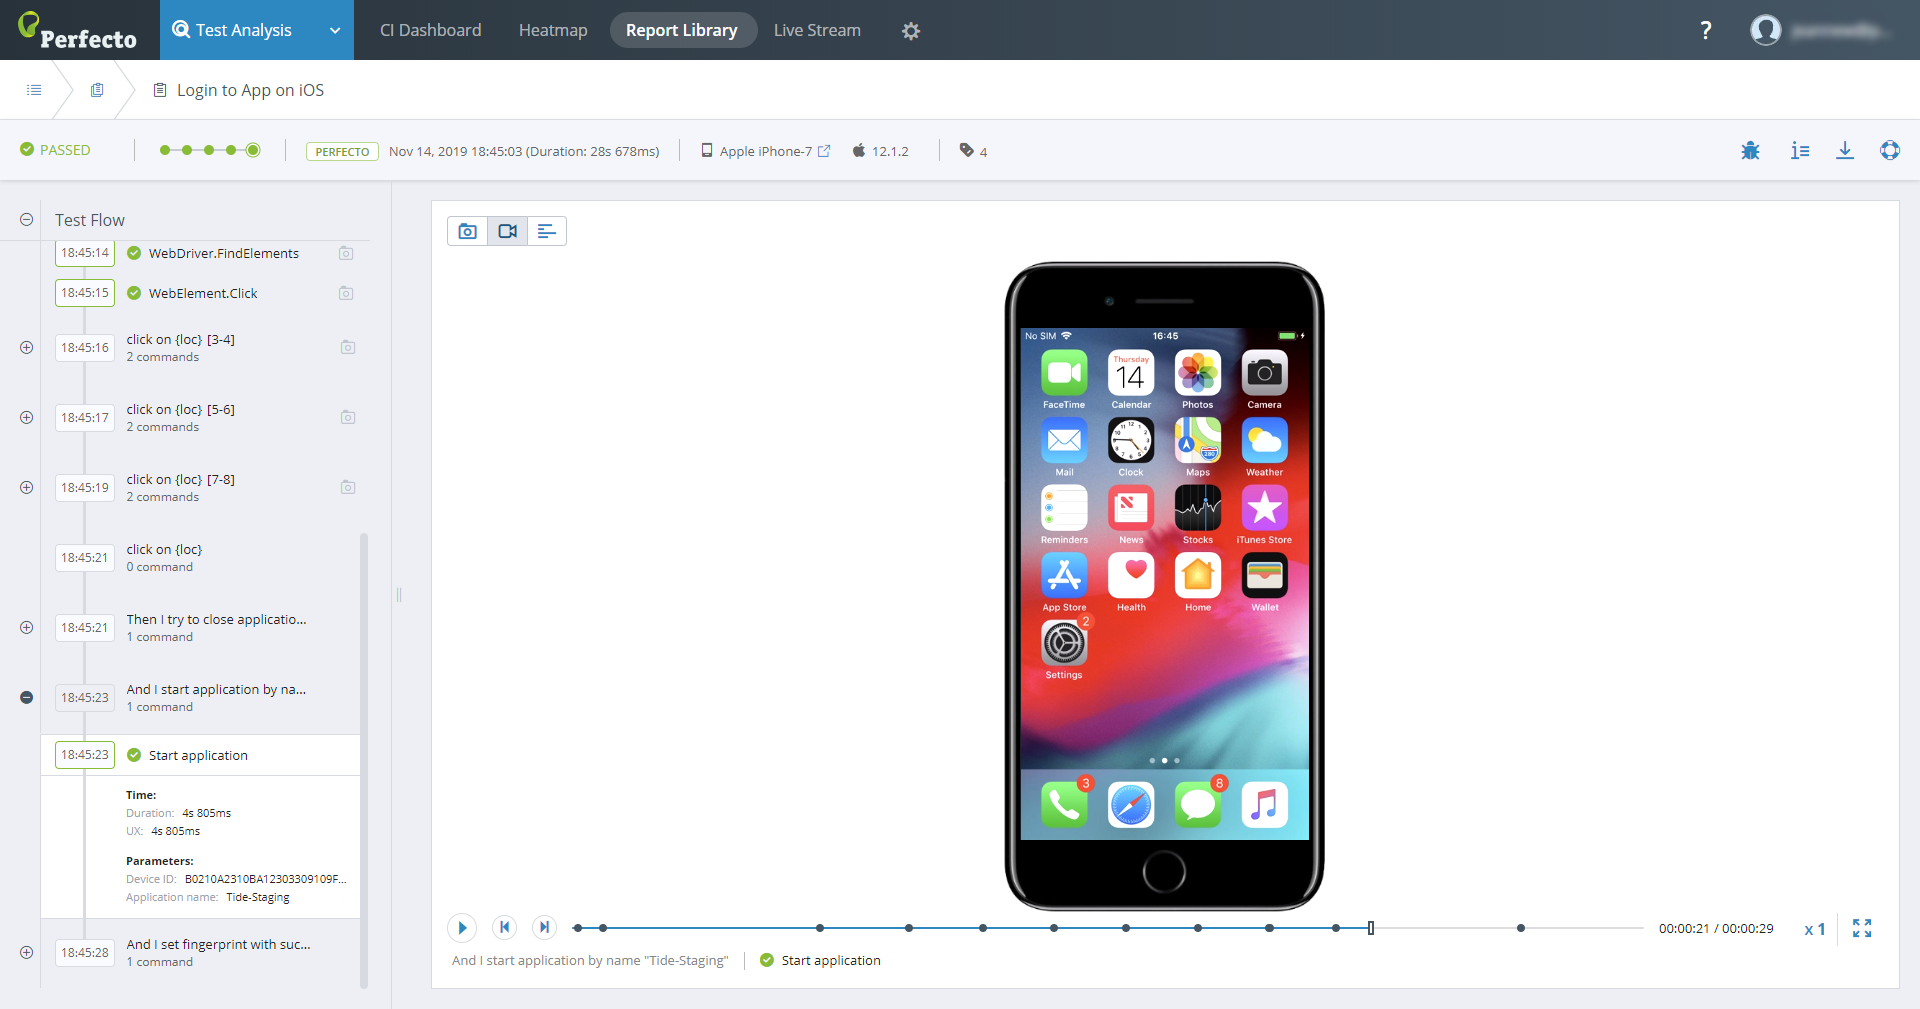
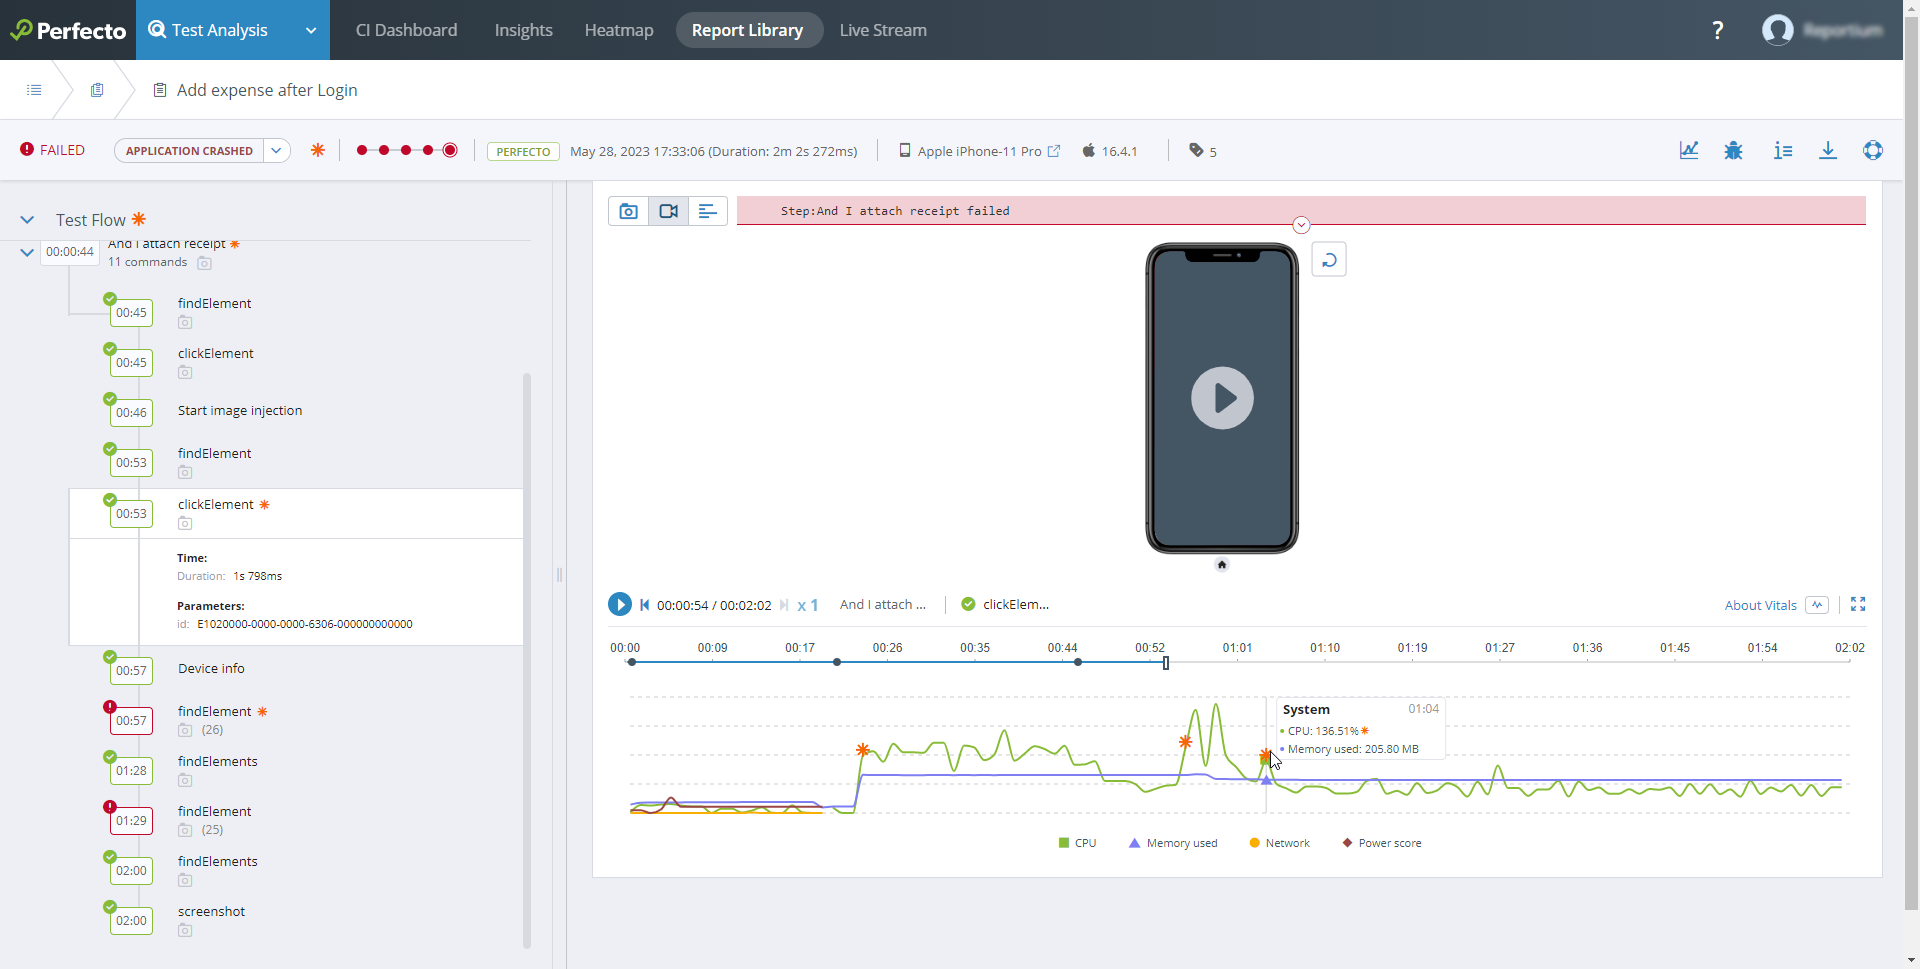
Clicking the name of an execution report in the Report Library opens the specific STR, as shown in the following figure. The report displays a list of the logical test steps on the left and a visual area for screenshots, video, and text artifacts, if available, on the right. The visual area includes a video and vitals timeline at the bottom, with the timeline points corresponding to the logical steps on the left.
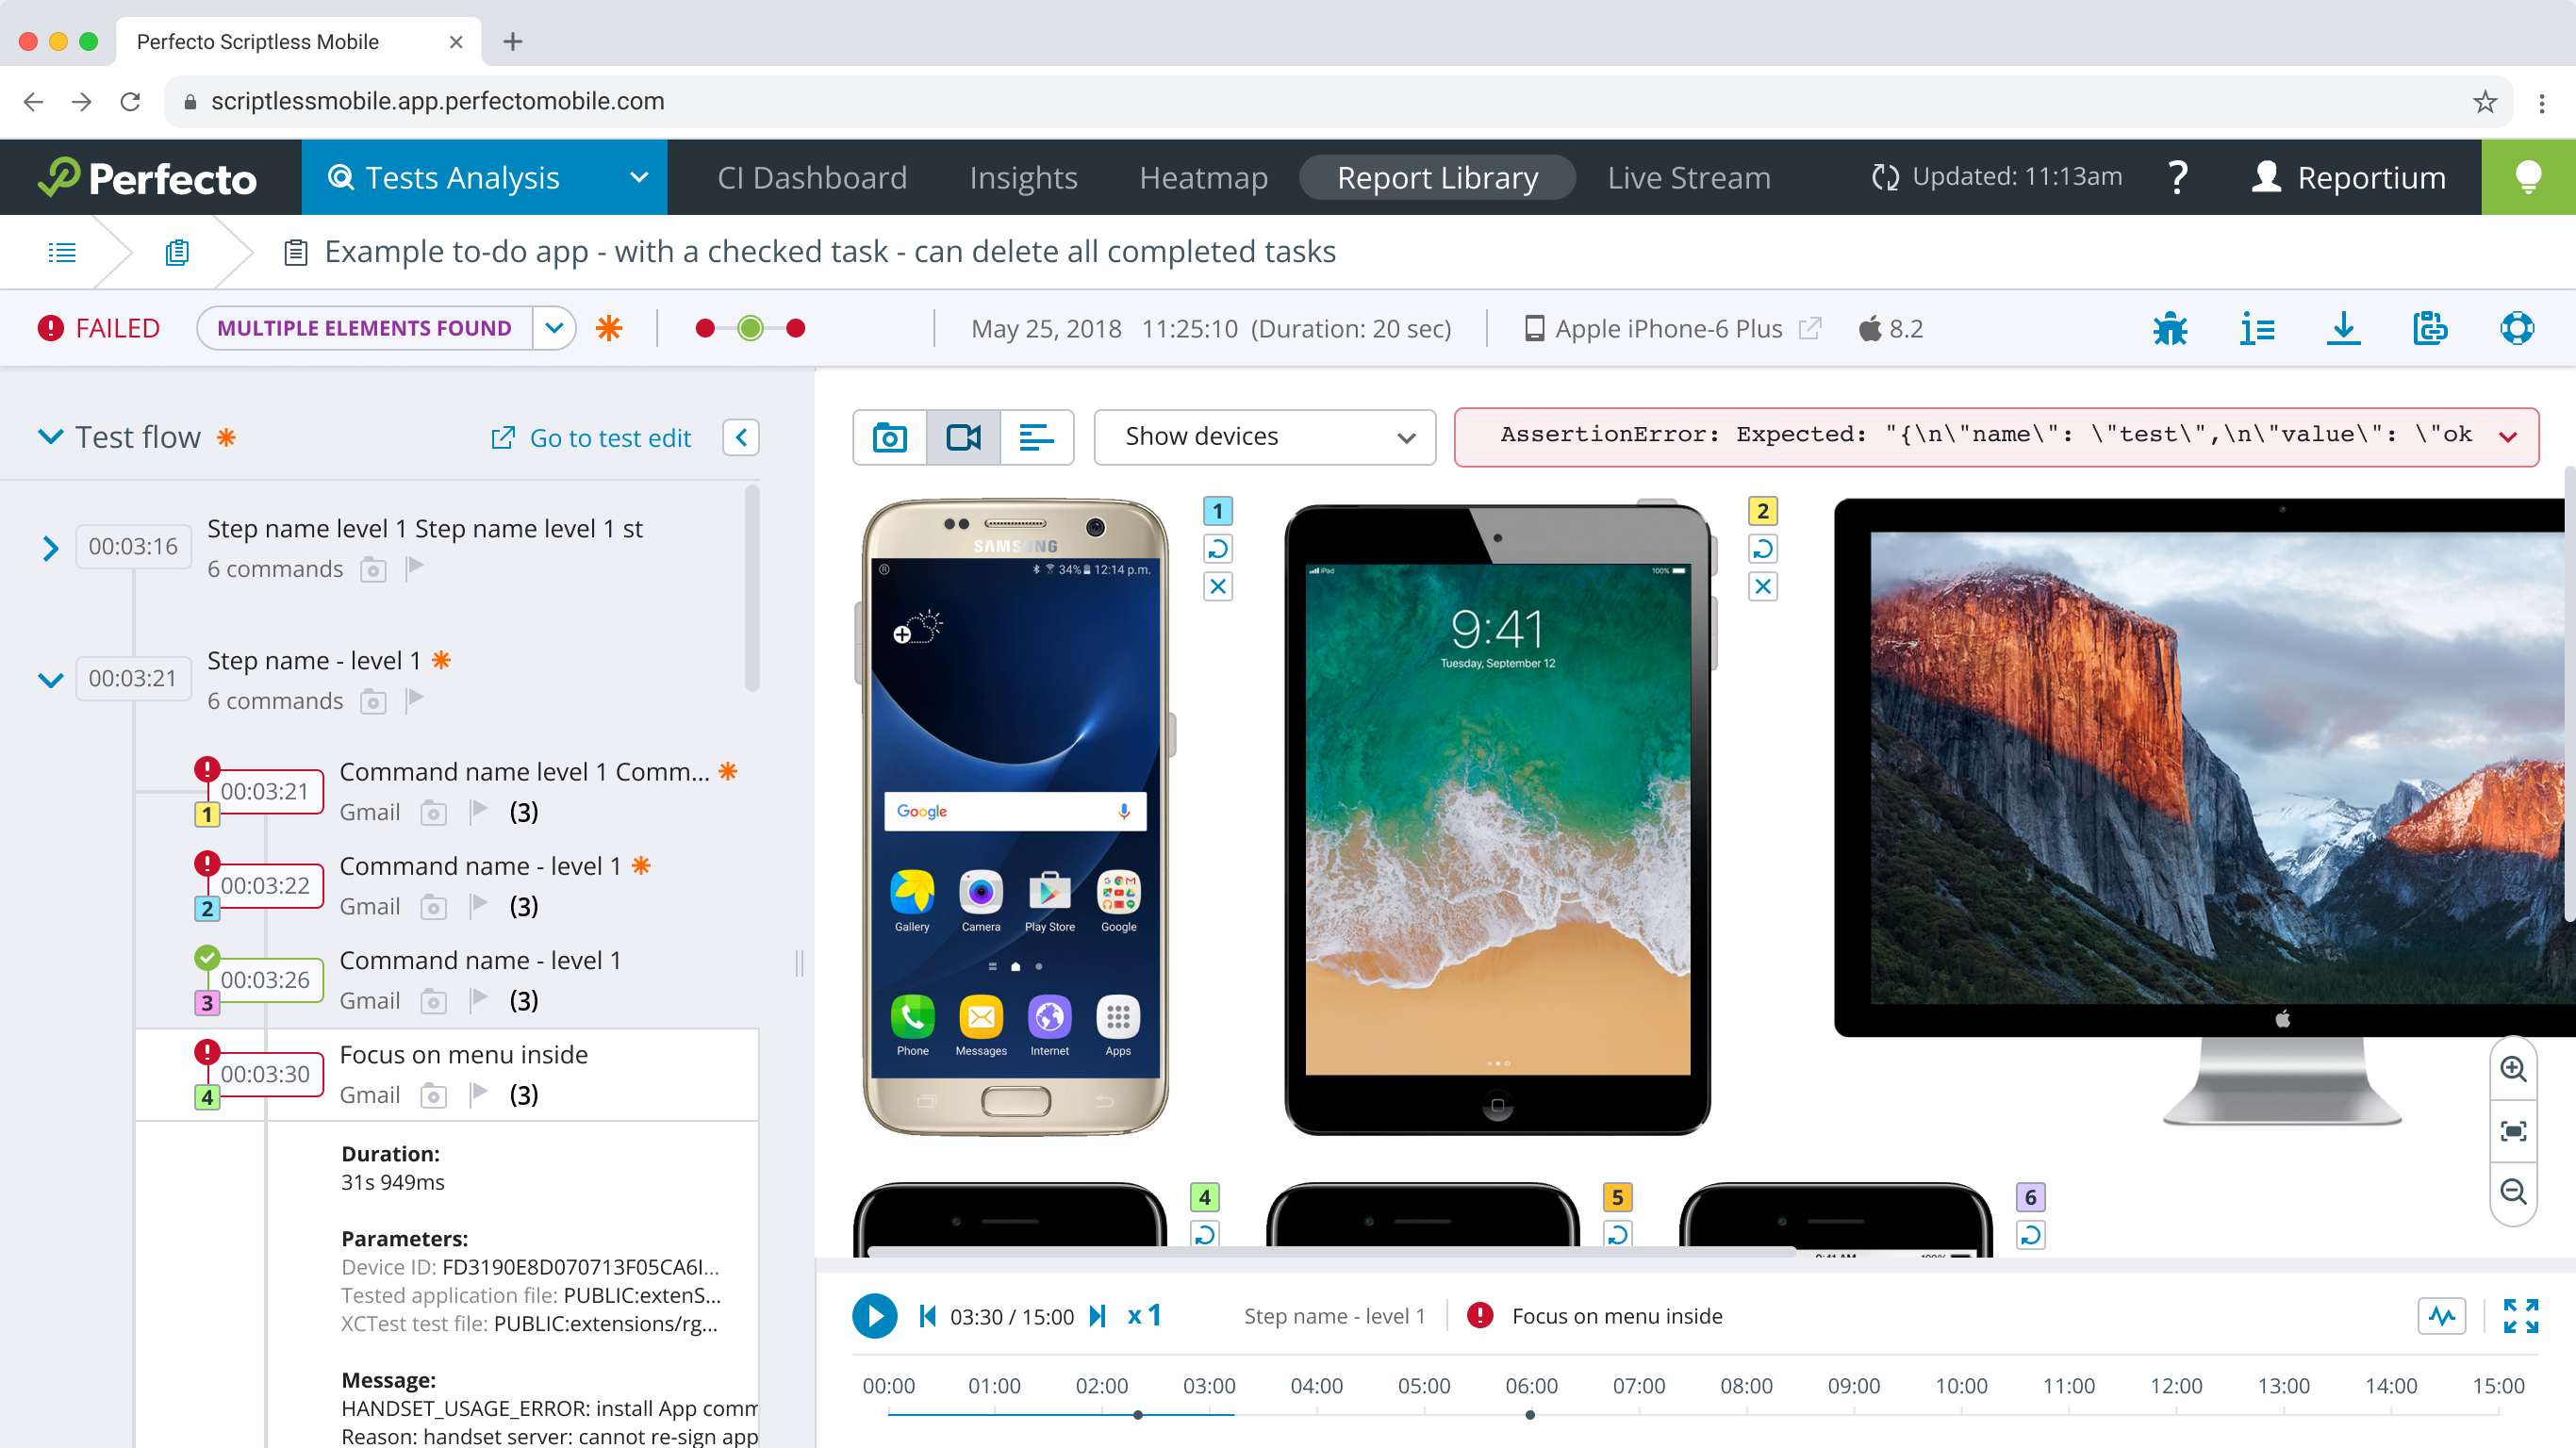
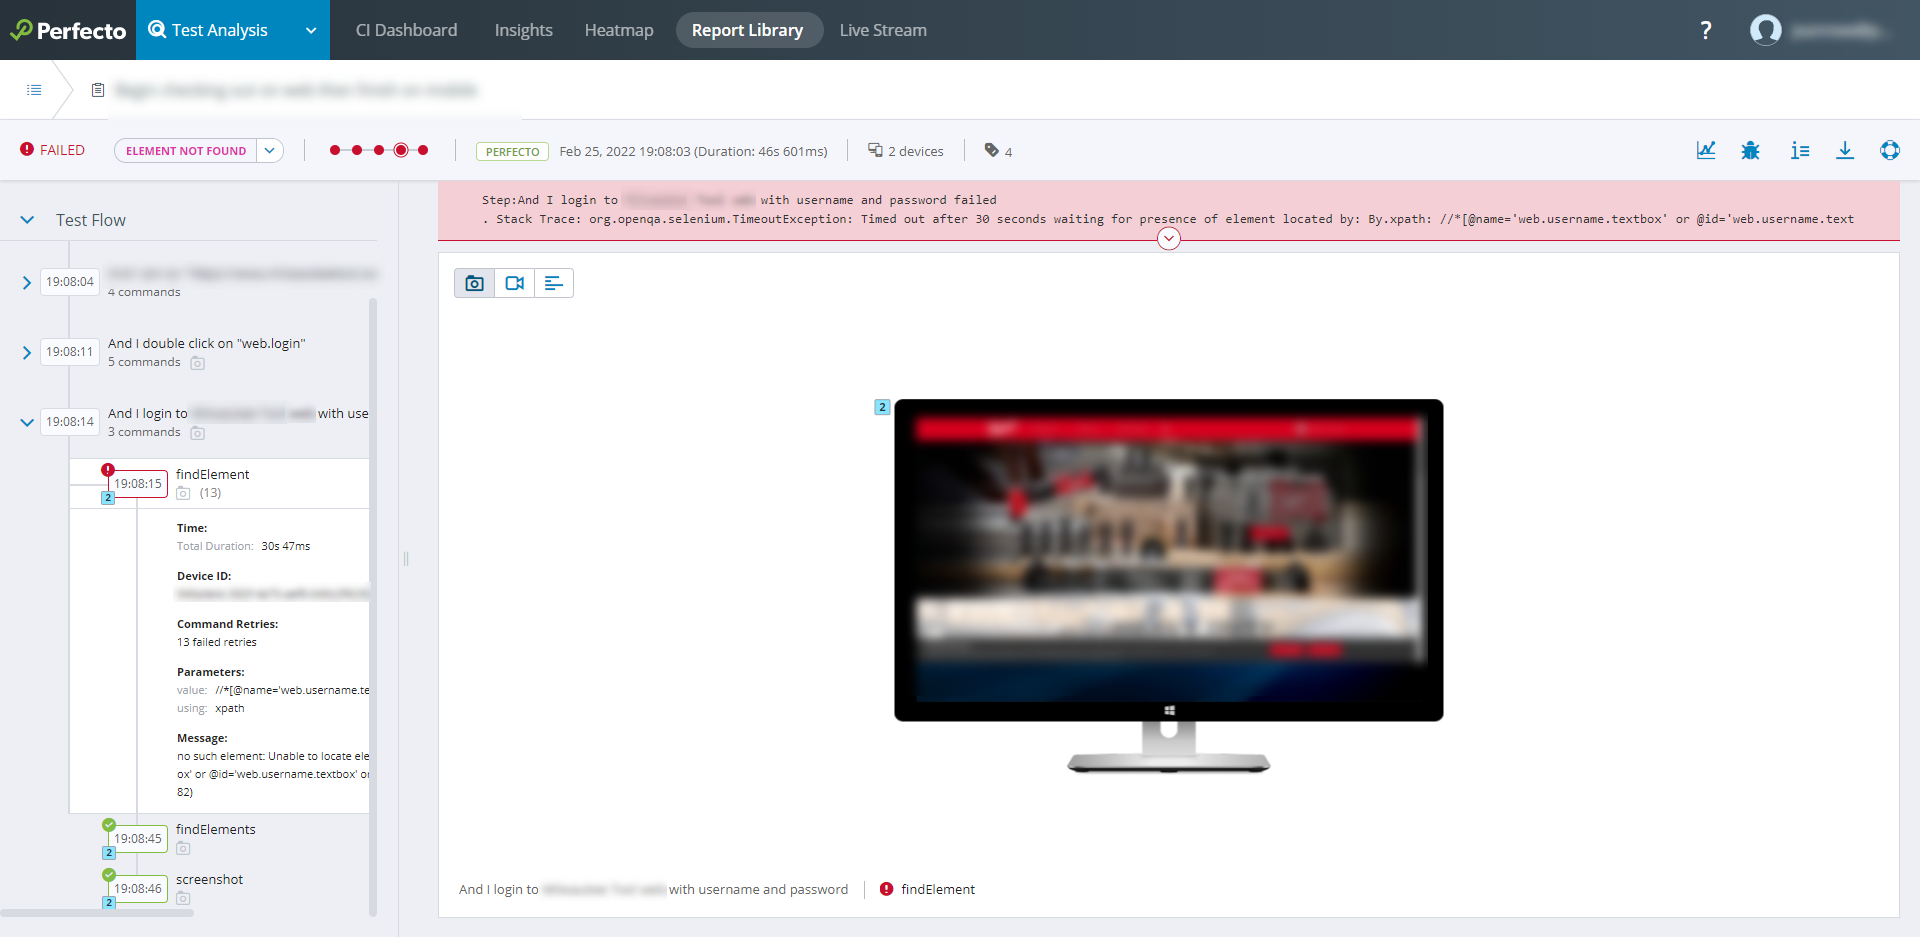
When a single test runs on multiple devices, the STR shows information on up to six devices simultaneously, as shown in the following image. For more information, see Navigate test reports with multiple devices.
The Single Test Report header consists of two lines that include the following information:
-
First line:
-
The Report Library button
 . Click to go back to the Report Library view, regardless of any navigation to other test report views.
 -
The name of the current test. Hovering over the name of the test displays the location of the test. If you want to view or modify the test, click the Open Test button
 to open the test.
 -
If the current test is part of a scheduled retry, the retry navigation bar:

Click Prev or Next to scroll through the individual retries.
-
-
Second line:
-
The status of the test run of this STR: Passed, Failed, Blocked, Unknown.
-
The failure reason or blocked reason, if applicable: From this list, you can assign a different failure or blocked reason, clear the failure reason, or add custom failure reasons. For details, see the following section (Failure reasons).
-
An incident indicator
 to alert you to abnormal vital stats (if performance vitals are turned on in your cloud). Move the pointer over the indicator to view a tooltip with details on the vitals incidents.
 Performance incidents can be absolute or relative in nature. Absolute incidents include the time an incident occurred. Relative incidents alert to a deviation (an increase) that was calculated based on the last 10 executions of the same automation test.
For absolute incidents, clicking a row in the tooltip brings you to the related step in the test flow on the left and to the exact point on the timeline of the video and vitals graph on the right.
The STR does not show vitals for:Tests with more than 6 hours of data. In this case, you can still download vitals information as a CSV file.
Tests that involve multiple devices.
-
The history graph: It shows five runs, similar to the history graph in the Report Library view. Clicking a node in the graph navigates to the STR of the selected run.
The History mechanism defines test similarity by test name and execution capabilities. If there is a difference in either the name or the capabilities (for example, the
osVersioncapability is included in one test run but not in another), the tests are considered 'not similar'. As a result, they are not connected in history.The test run whose details are described in this report is displayed as a double-ring in the history (
 ). This makes it easier to identify when this test run was executed relative to other test runs. When reading the history graph, keep in mind that:
 -
The latest test run is always represented by the right-most node.
-
No more than five nodes appear in the history graph. If the specific run occurred prior to the five latest runs, the graph shows a break represented by three dots (
 ).
). -
The color of the node represents the test result status for that particular run, where green means 'passed', yellow means 'blocked, and red means 'failed' (
 ).
). -
Move the pointer over a node to display a tooltip with details for that run.
-
Arrows around an icon (
 ) identify test runs with scheduled retries that have been collapsed into a single test report.
-
-
Run information: Start time and duration information of the test's run.
-
Device information: Information on the device or devices used for the test run.
-
Open device button
: Opens the device in a Perfecto Lab interactive session. If the device is not available, the Perfecto Lab will notify you to select another device.
-
-
Tags: A list of tags associated with the test run.
-
Test Failure History button
 : Opens the Test failure history view. This view is part of Insights, Perfecto's dashboard for advanced root cause analysis. This widget is useful if you want to understand how stable a test is. If you see that it does not pass consistently, you may then have to go back to the test case and make sure that it runs locally.
 -
JIRA bug reporting button
 : Appears if Smart Reporting is integrated with Jira. Supports entering bug reports directly as a Jira issue.
 -
Report Details button
 : Displays detailed information on the test run data and device(s) data.
 -
Download button
 : Supports accessing and downloading the artifacts (video, network files, log files, vitals) associated with the test run.
 -
View captured HAR file button
 : Supports viewing the HTTP Archive (HAR) file for the test report that includes it. Clicking the button visualizes the HAR file in a new browser tab. If multiple files exist, the first HAR file is shown.
The following image shows a sample HAR file (click to enlarge it).
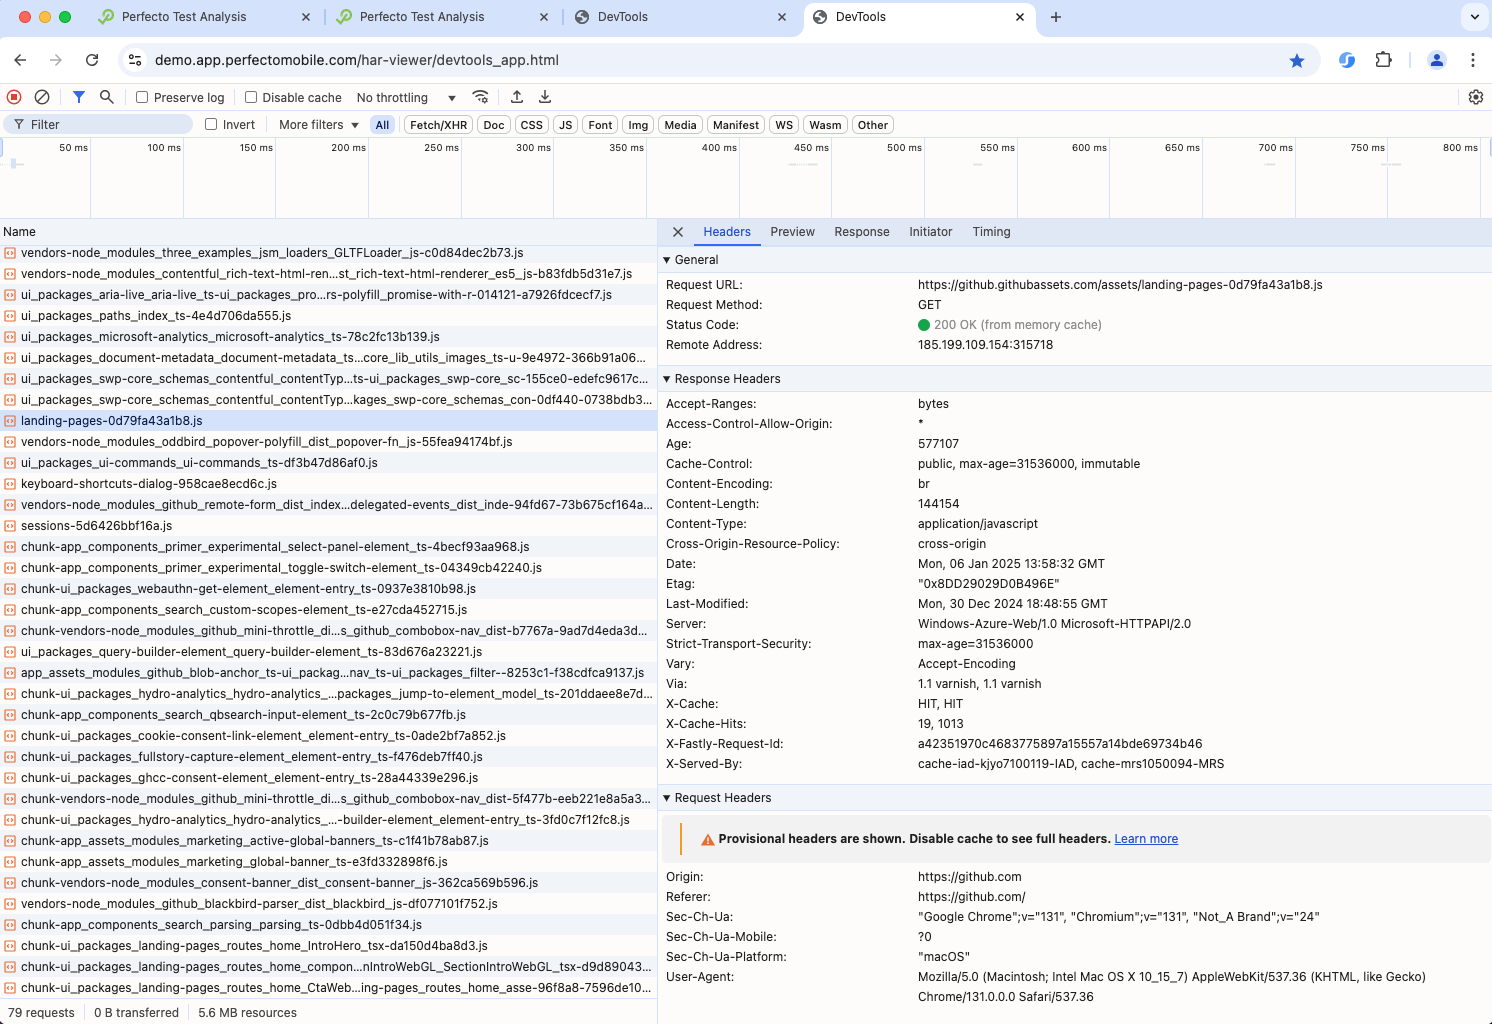
Viewing the HAR file can help you troubleshoot issues by providing insight into HTTP network traffic between the client and server. This allows you to identify problems such as failed requests or unexpected responses, which could indicate errors or backend issues impacting your tests.
HAR files are only supported in enterprise clouds.The HAR file button is only available if the test contains a HAR file and if viewed in a supported browser. Supported browsers are Google Chrome and Microsoft Edge.
The HAR file viewer supports HAR files up to a size of 250 MB. HAR files that exceed this limit are available for download through the Download button
(Network files option).
-
When the test script or Smart Reporting heuristics have identified a failure reason, it appears in the second line next to the test status (only if the status is Failed). The failure reason is one of those configured for the Perfecto Lab by the administrator (to learn more, see Failure reason management).
For additional root cause analysis, check if any information is available in the in the Execution Insights pane on the right. If the pane is closed, click the execution insights button  . To learn more, see Identify the cause of failure.
If no failure reason was identified for a failed test, the Add failure reason button is displayed instead. You can add and update a failure reason.
To add a failure reason:
- Click Add failure reason.
- From the list of preconfigured failure reasons that appears, select a failure reason by select Add custom failure reason to enter a new failure reason.
To update a failure reason:
- If you don't think the displayed failure reason is the cause of the issue, click the current failure reason.
- From the list of preconfigured failure reasons that appears, select a different reason or select Clear failure reason.
If the assigned reason is Blocked, you cannot update the reason.
The left pane of the STR view shows a list of the logical steps that comprise the test (as named in the testStep() method).
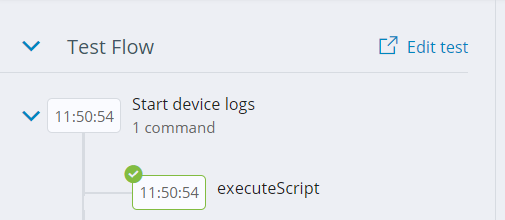
If the test was created in Scriptless Web, an Edit test link appears above the logical steps. The link brings you back to the test execution page in Scriptless Web, provided the test is still available. If the test includes an embedded test, click the Open Test button ![]() to open the embedded test.
to open the embedded test.
A step's time stamp includes an icon that indicates if the step passed or failed. If the test run includes more than one device, the time stamp also includes a number that identifies the device against which the step was run. Hovering over the number displays a tooltip with the device name. For more information on the device, you can hover over the device information icon in the second line of the STR header.
Reports for native automation executions that activate nested scripts include the steps of both the main script and the nested script. The commands of the nested scripts are identified by a special symbol ("</>"). Clicking a logical step reveals a view of the artifacts (video and vitals graph, screenshots, expected vs. actual values) associated with the particular command or step.
Reports for manual testing sessions may include checkpoints with comments and screenshots that indicate the outcome of a particular test step.
Only if performance vitals are turned on in your cloud: If a step incurred abnormal vital stats, an incident indicator  appears to the right of the step name. Move the pointer over the indicator to view a tooltip with details on the vitals incidents. For specific incidents, clicking a row in the tooltip brings you to the related command inside the step and to the exact point on the timeline of the video and vitals graph on the right.
If performance vitals are turned on in your cloud and the vitals graph is visible in the right pane, selecting a logical step displays a tooltip with metrics relevant to the command on the timeline above the vitals graph:
-
If the command is linked to a performance incident, the tooltip provides information on the incident.
-
If the command is not linked to a performance incident, the toolship shows information about the first metric related to the command.
You can expand a command to display detailed information about the command execution, including:
- Timer information: Displays the time when the command was executed, relative to the beginning of the test (the time that has elapsed since the test started).
-
Parameter information: Identifies the following:
-
The device used for the command
-
The UI element (if the command accessed a UI element)
-
The text sent to the UI element (if the command inserted text)
If the text was sent as a Secured String, the text value does not display. Instead, it appears as: "***"
-
Other information, such as parameters for visual analysis, assertion information, UI element attribute values, or the download URL for an audio file created during the test run
-
Clicking a command updates the video location in the right pane (if the video is displayed).
If a command incurred abnormal vital stats, an incident indicator appears to the right of the command name. Move the pointer over the indicator to view a tooltip with details on the vitals incidents.
The right pane of the STR view presents visual artifacts from the test run. Artifacts can be screenshots, a video and vitals graph, or textual files.
For real and virtual iOS and Android devices, videos include a rotate option ![]() that you can use to switch from portrait mode to landscape mode, or vice versa.
that you can use to switch from portrait mode to landscape mode, or vice versa.
Only if performance vitals are turned on in your cloud: When you view a video, the timeline is synchronized with the vitals graph below the video.
The timeline includes indicators  that poinpoint the times at which the logical steps occurred. Moving the pointer over any of these points displays a tooltip that identifies the corresponding logical step. Clicking a point in the timeline updates the location of the video and vitals graph and highlights the corresponding step in the left pane.
The toolbar below the video lets you:
-
Start
 and pause
  the video
 -
Go back
 or forward
-
Increase the replay speed
 (up to 4 times the original speed)
 -
View the video in full-screen mode

-
Hide or show the vitals graph
 (displayed by default)
The button is grayed out when vitals are not available. If vitals are not supported for a particular device, this is indicated by a message next to the vitals button.
-
Open documentation (by clicking About Vitals) with information on the metrics shown in the vitals graph
The vitals graph shows the name of the front-most application in the tooltip. Each metric in the graph comes with a color-coded line and a unique shape, as displayed in the legend below the graph.
An incident indicator on the vitals graph indicates a point in time when abnormal vital stats were recorded.
Performance incidents can be absolute or relative in nature. Absolute incidents include the time an incident occurred. Relative incidents alert to a deviation (an increase) that was calculated based on the last 10 executions of the same automation test.
To view details on any point, move the pointer over the graph to display a tooltip. If you move the pointer over an incident indicator, the tooltip also indicates which of the values corresponds to the incident.
Selecting a logical step in the left pane displays a tooltip with metrics relevant to the command on the timeline above the vitals graph:
-
If the command is linked to a performance incident, the tooltip provides information on the incident.
-
If the command is not linked to a performance incident, the toolship shows information about the first metric related to the command.
The following table describes the vitals collected and explains when absolute and relative performance incidents are logged.
| Vital | Description | Absolute performance incident | Relative performance incident (Report Library/STR only) |
|---|---|---|---|
|
CPU |
The total CPU usage as derived from the OS, in percentage (%). The value takes into account all processes available on the device. |
Reported when the usage exceeded 95% for more than 2 consecutive seconds |
Reported when CPU usage is at least 20% above the average of the previous 10 executions |
|
Memory Used |
The overall memory consumption, in megabyte (MB). |
N/A |
Reported when the maximum memory usage in this execution is at least 20% above the average of the previous 10 executions |
|
Network In |
The amount of data received from either the wireless or the mobile network, in megabits (Mbit) per second. |
N/A |
Reported when the maximum network in is at least 20% above the average of the previous 10 executions |
|
Network Out |
The amount of data sent to either the wireless or the mobile network, in megabits (Mbit) per second. |
N/A |
Reported when the maximum network out is at least 20% above the average of the previous 10 executions |
|
Power Score |
The grade at which the application under test uses energy, between 1 and 100. |
Reported when the power score exceeded 80 for more than 2 consecutive seconds |
Reported when both of the following are true:
|
When the test script displayed in the STR generated an error or failure message, the message is displayed at the top of the visual artifacts area. At first, only the header line of the error message is displayed on a red background. To see the full message, together with a stack dump (if relevant), click the down arrow below the error message:
For additional root cause analysis, check if any information is available in the in the Execution Insights pane on the right. If the pane is closed, click the execution insights button . To learn more, see Identify the cause of failure.
Perfecto can be configured to collapse scheduled retries into a single test report. This feature is turned off by default. To turn it on in your cloud instance, contact Perfecto Support.
For a test to be considered a retry, it must share the same parameters and CI job name and number or be part of the same execution. Perfecto does not list a test that is considered a retry in the table and does not take it into account when calculating statistics. Only the last test in a retry series makes it into the statistics.
If the current test is part of a scheduled retry, this is indicated by two arrows surrounding the double-ringed current-run icon (![]() ). In this case, the first header line includes the retry navigation bar (). You can use this bar to scroll through the individual retries.
). In this case, the first header line includes the retry navigation bar (). You can use this bar to scroll through the individual retries.
The following video illustrates how the scheduled retry feature works.
Also in this section